Gartner, Inc.'s management explains the business in its own materials. The slides below do the most of that work, pulled from the documents preserved in Sources. Each source link opens the complete presentation at that slide in a new tab.
The latest quarterly deck and the fullest self-contained picture Gartner publishes: the client flywheel, all three segments, the subscription unit economics, and capital allocation. · Open the full document →
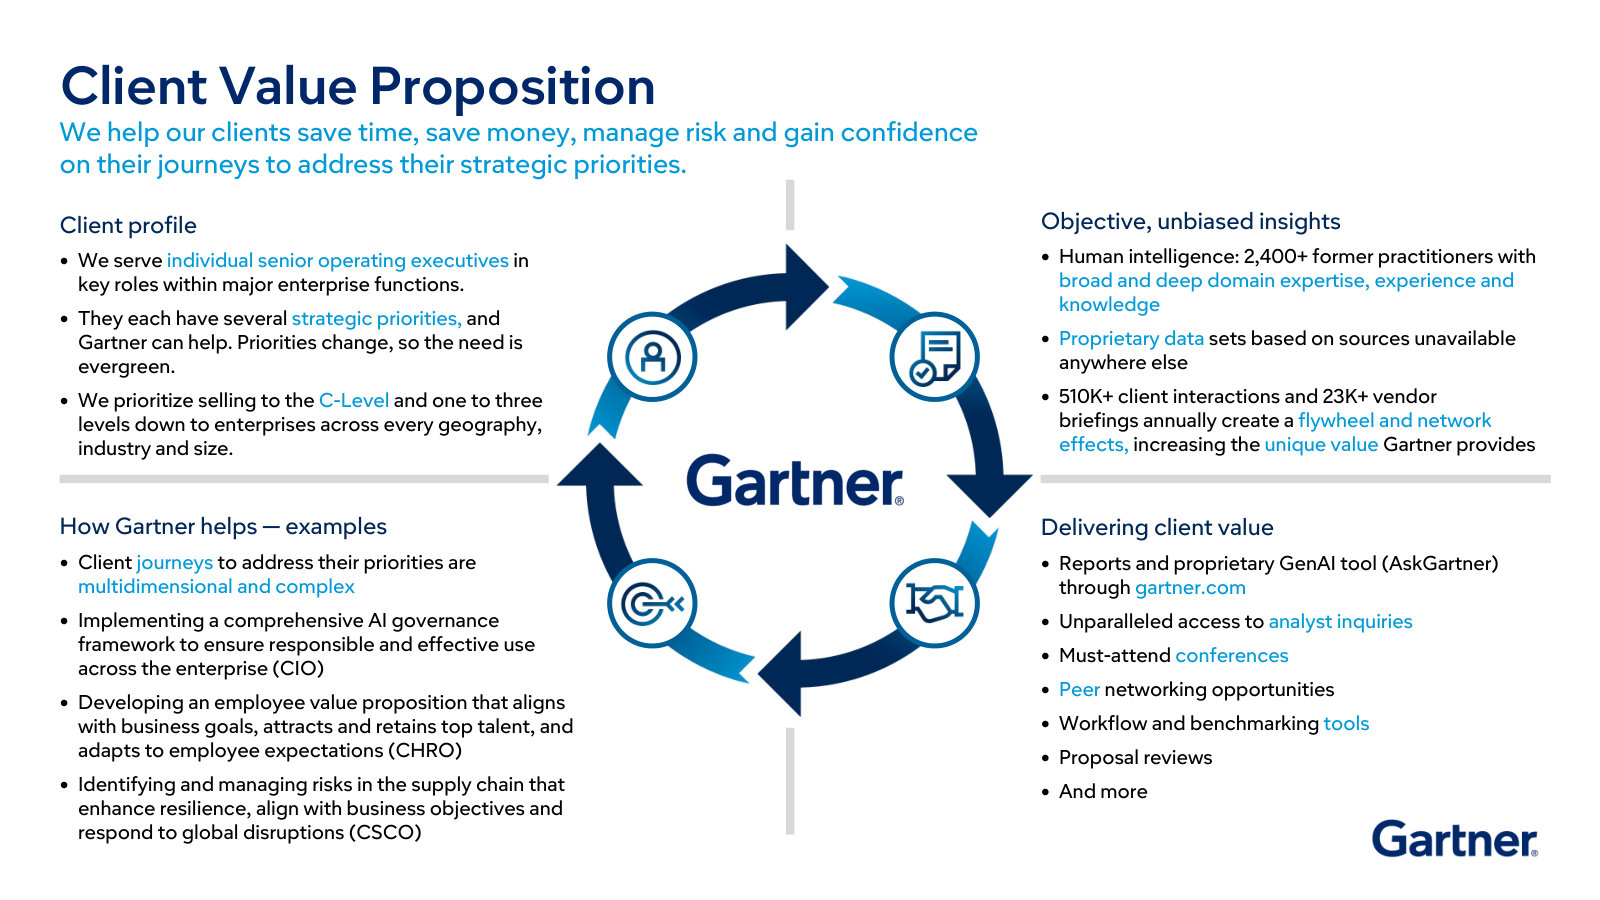
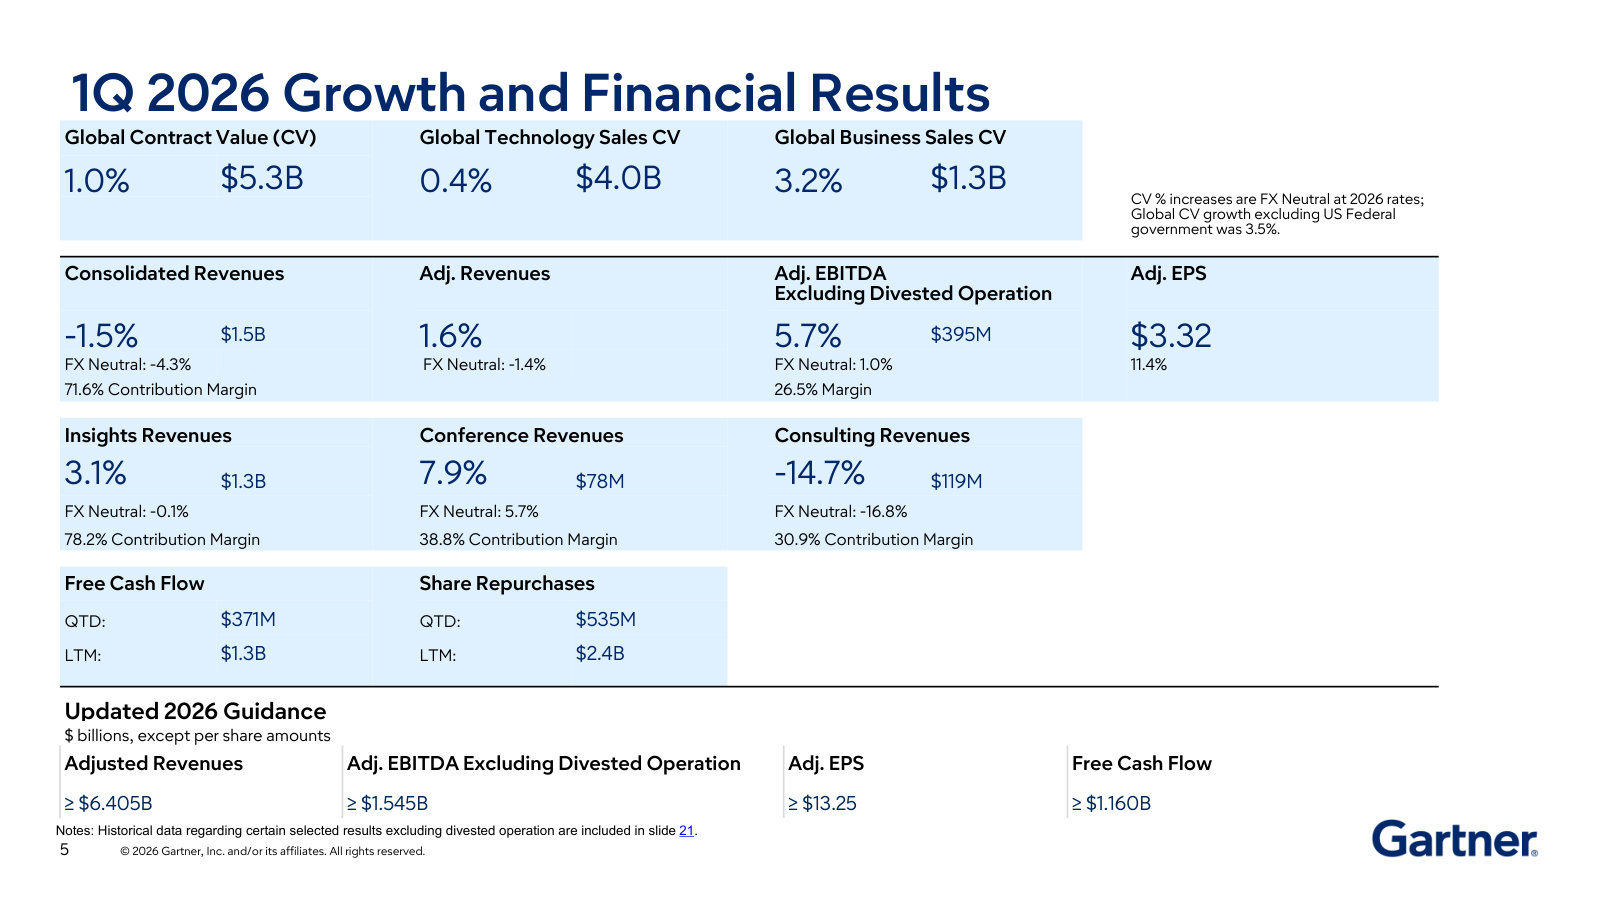
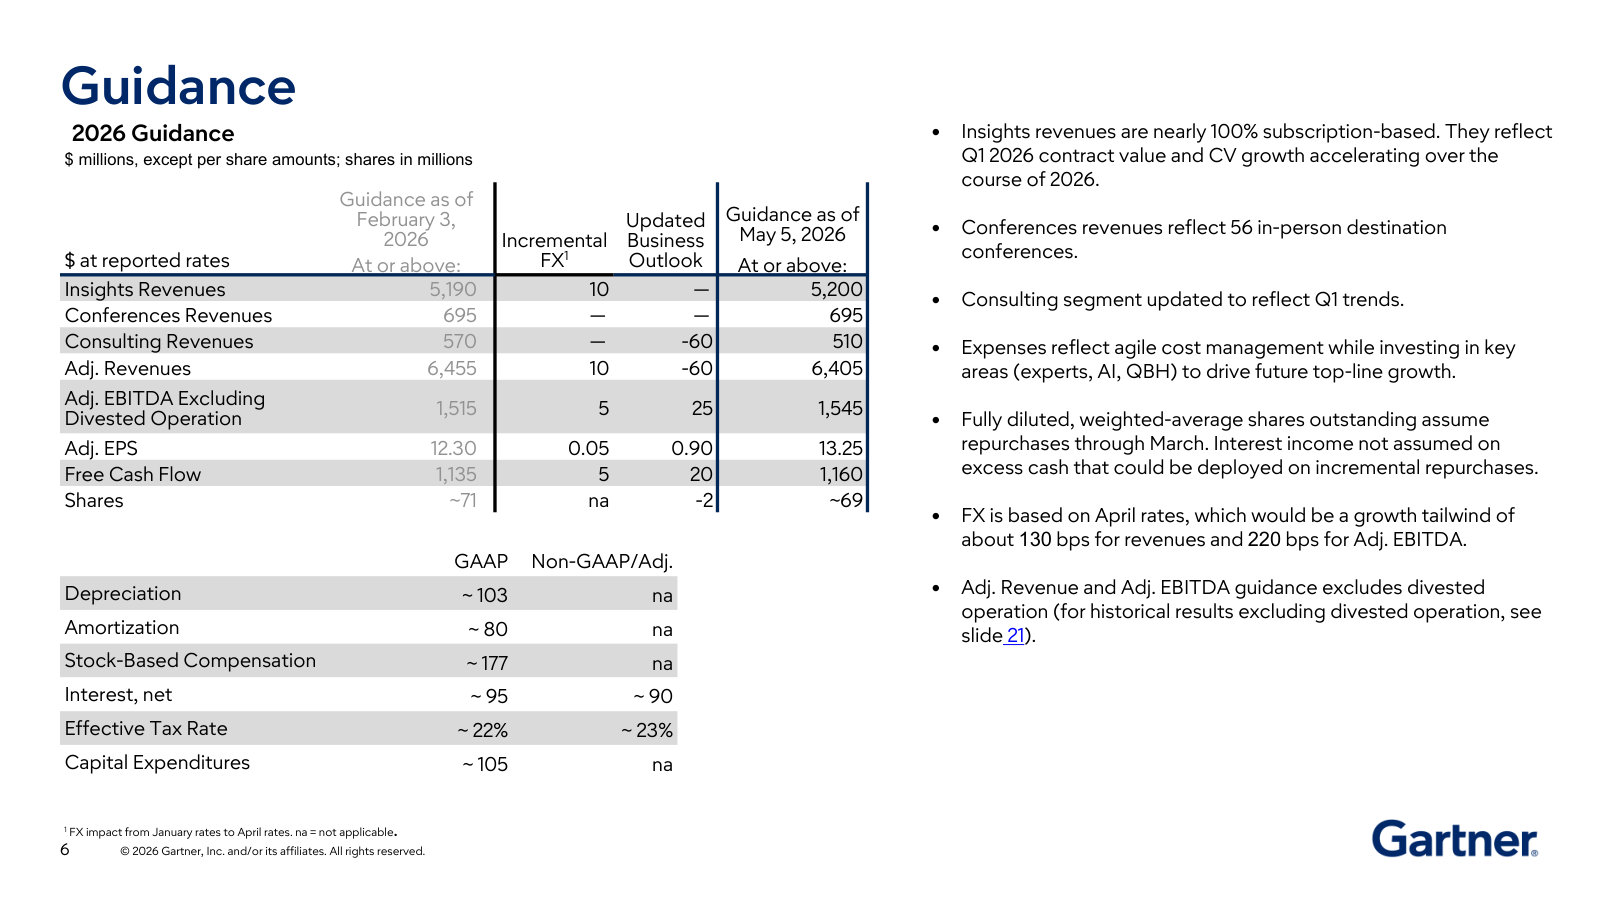
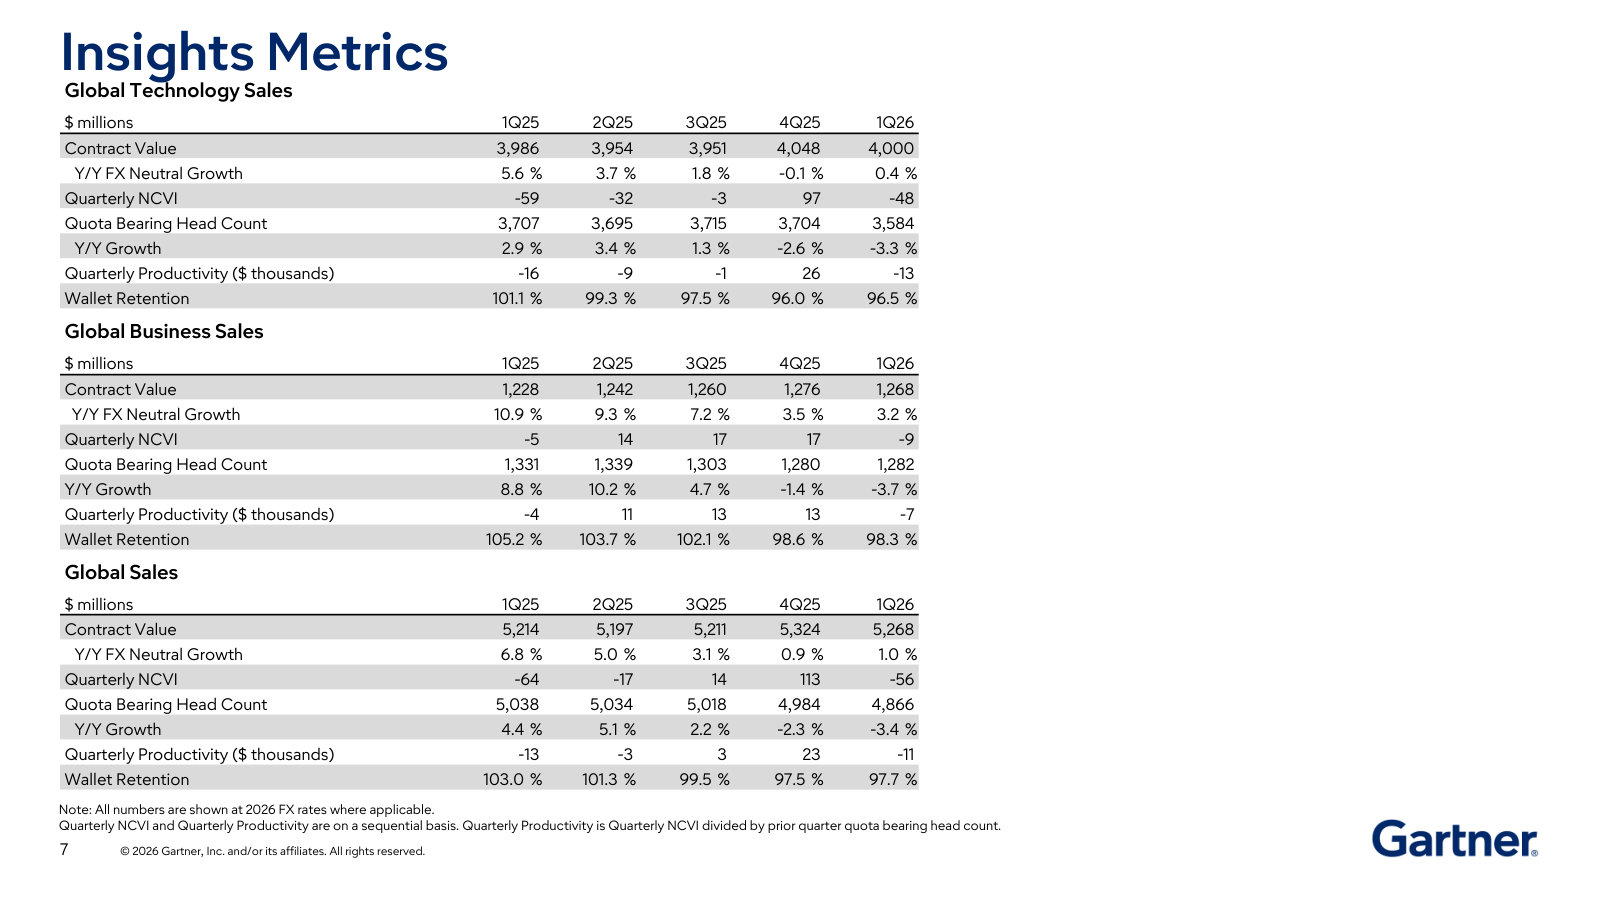
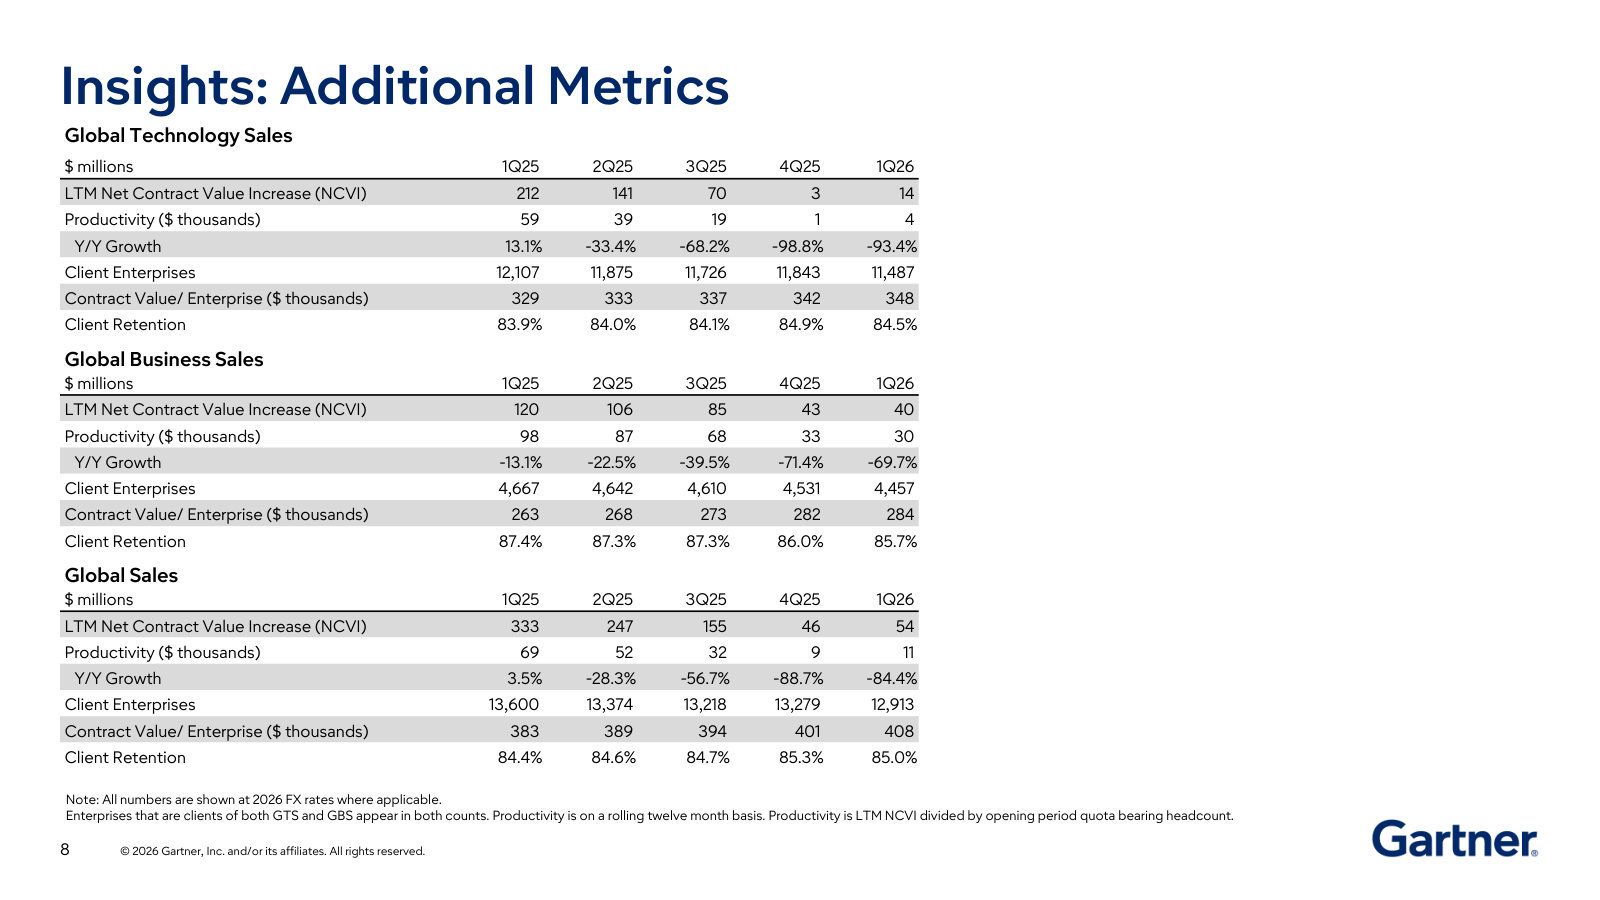
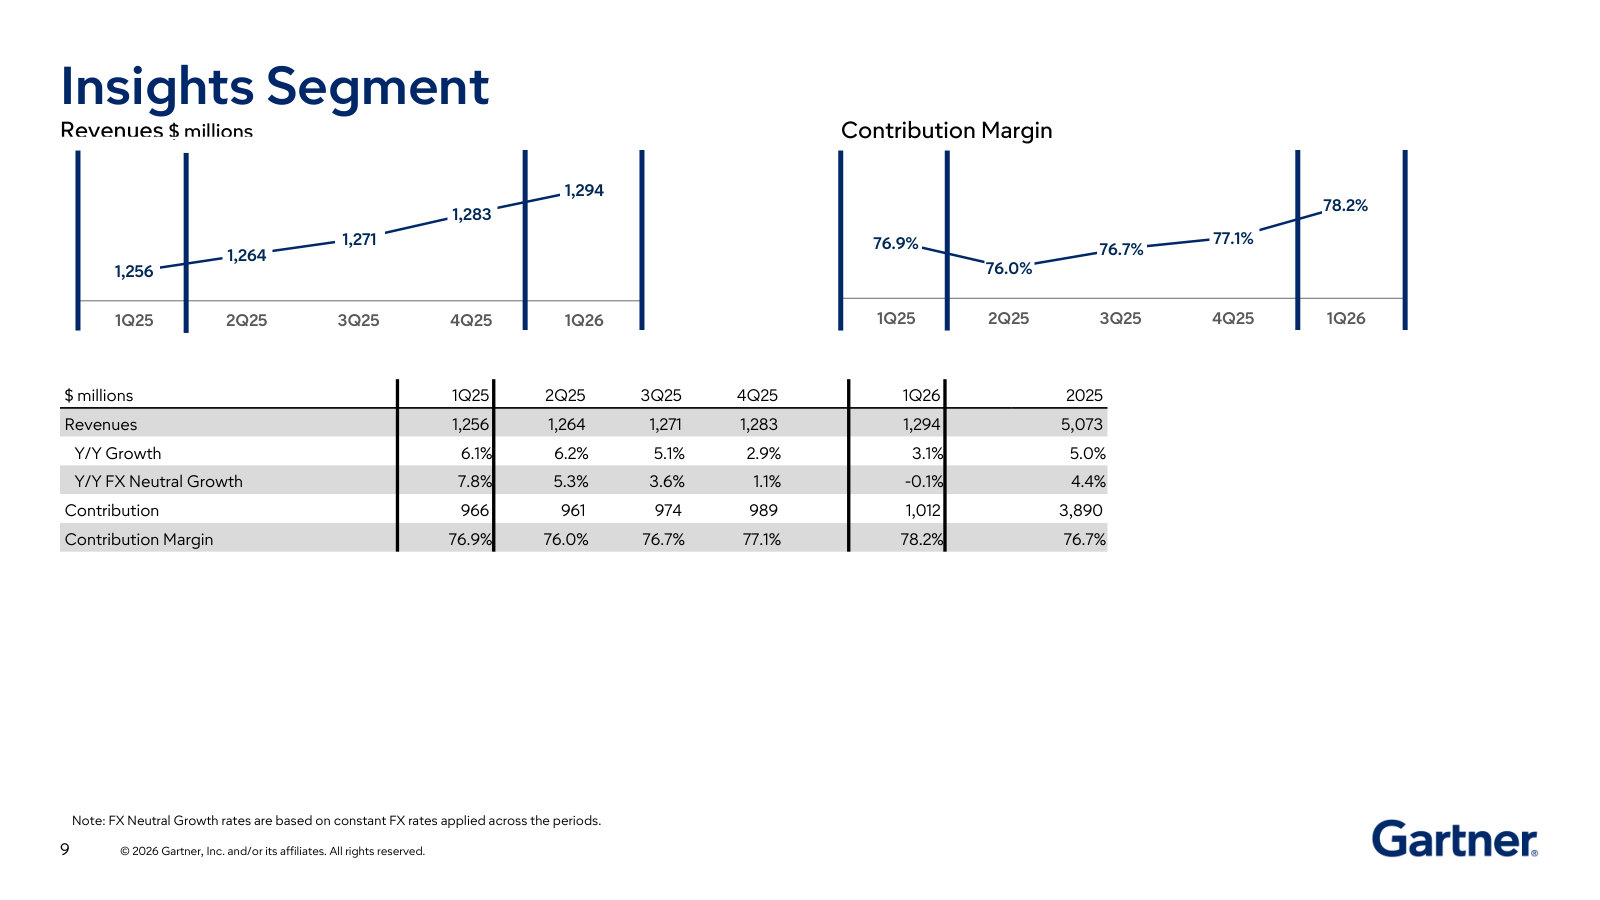
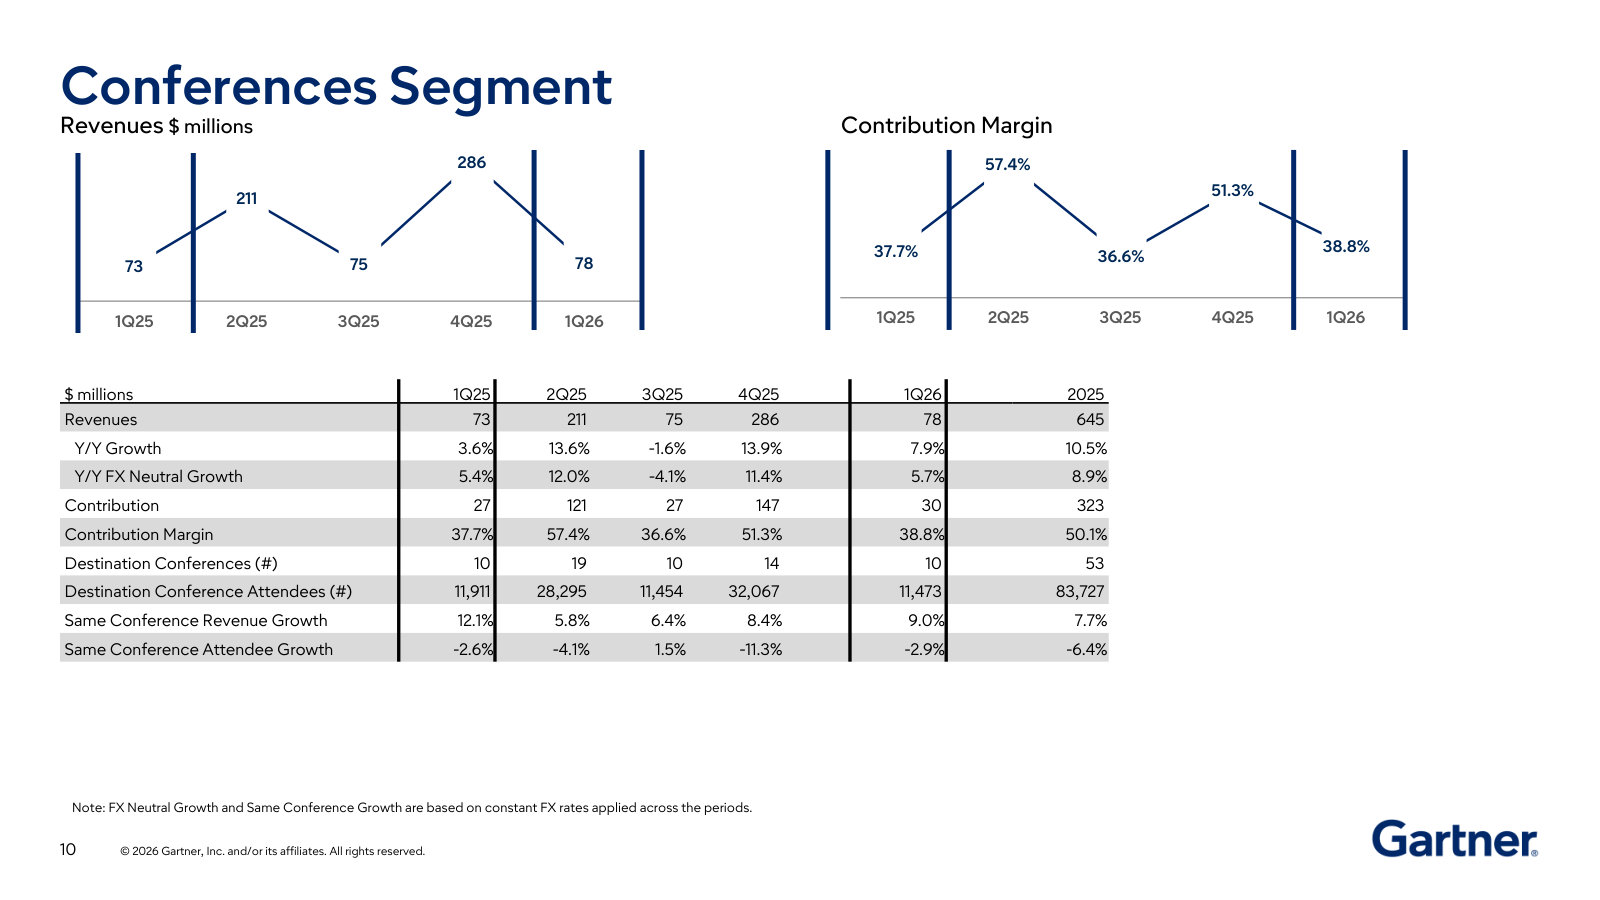
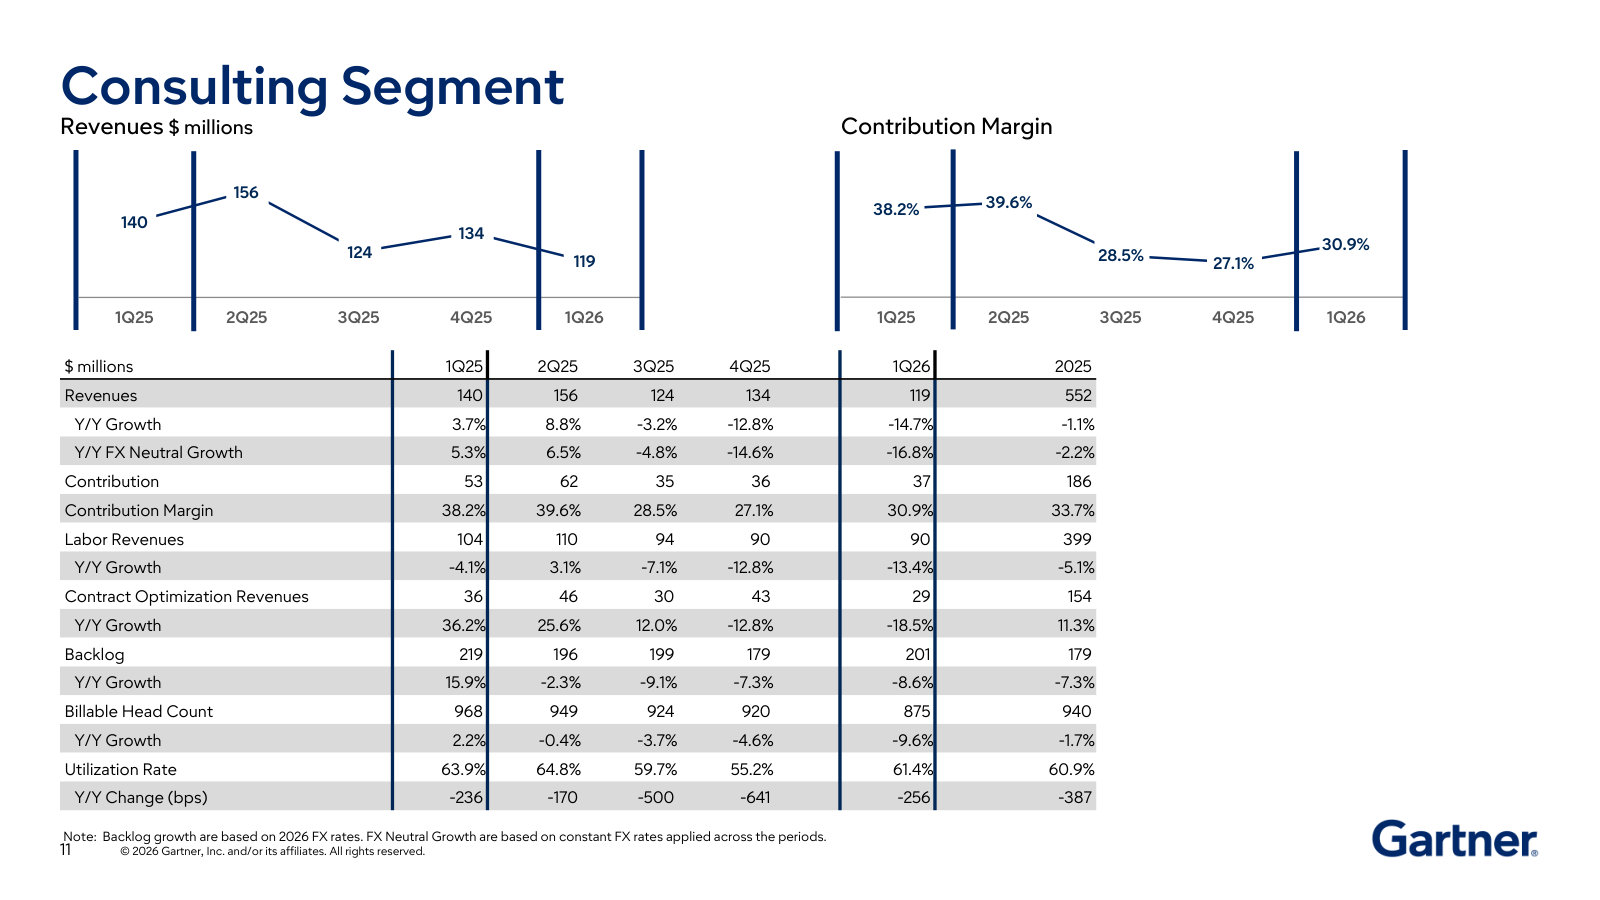
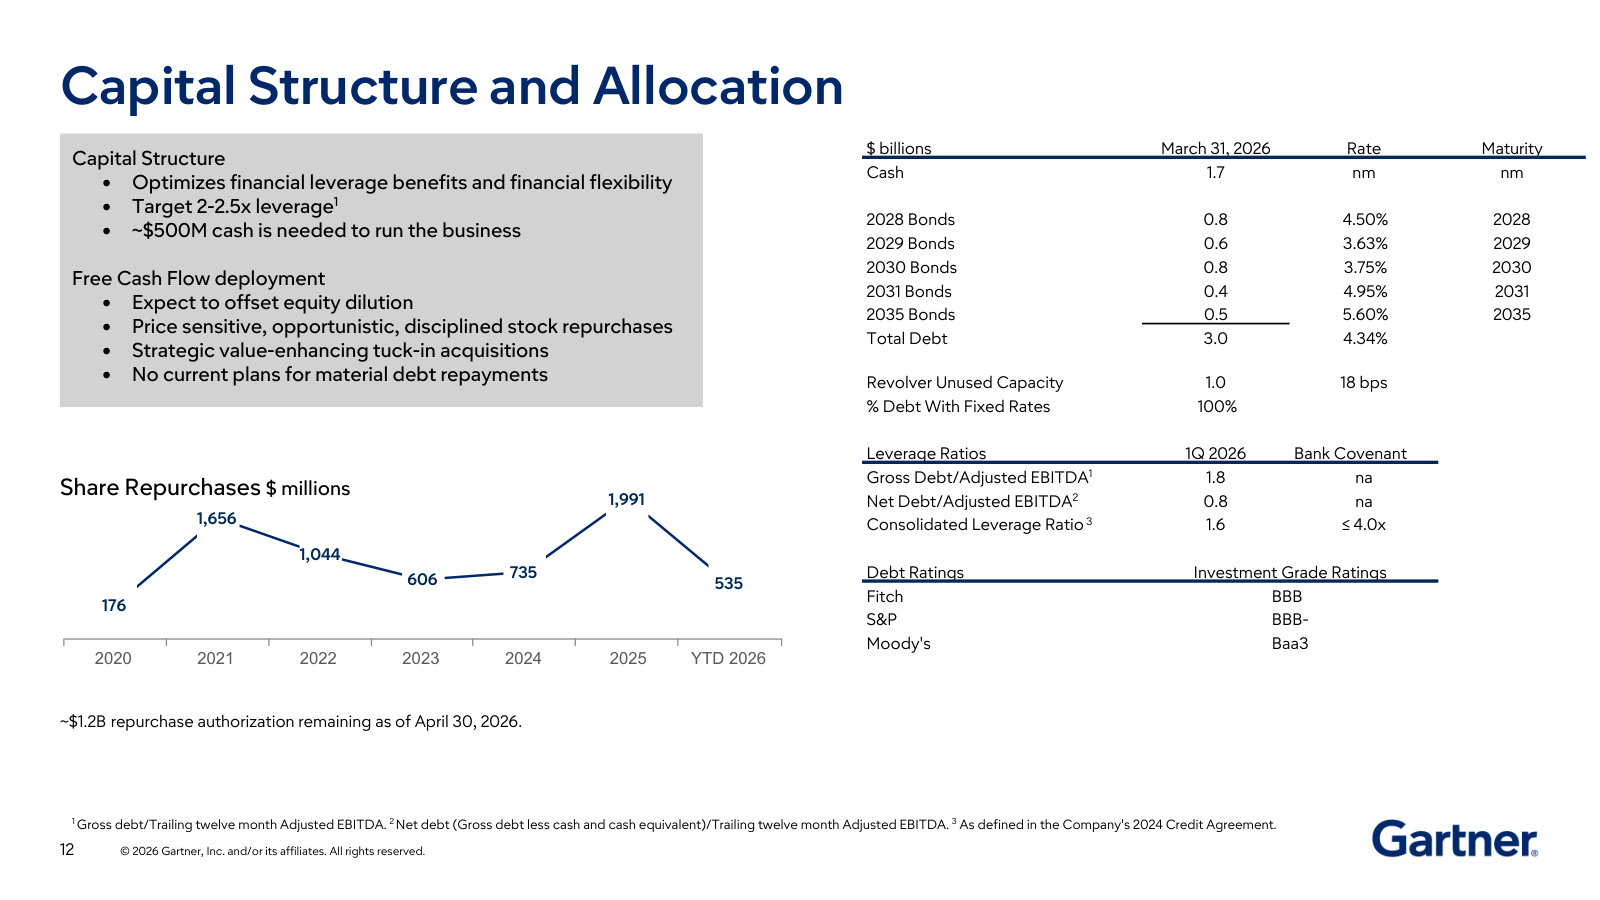
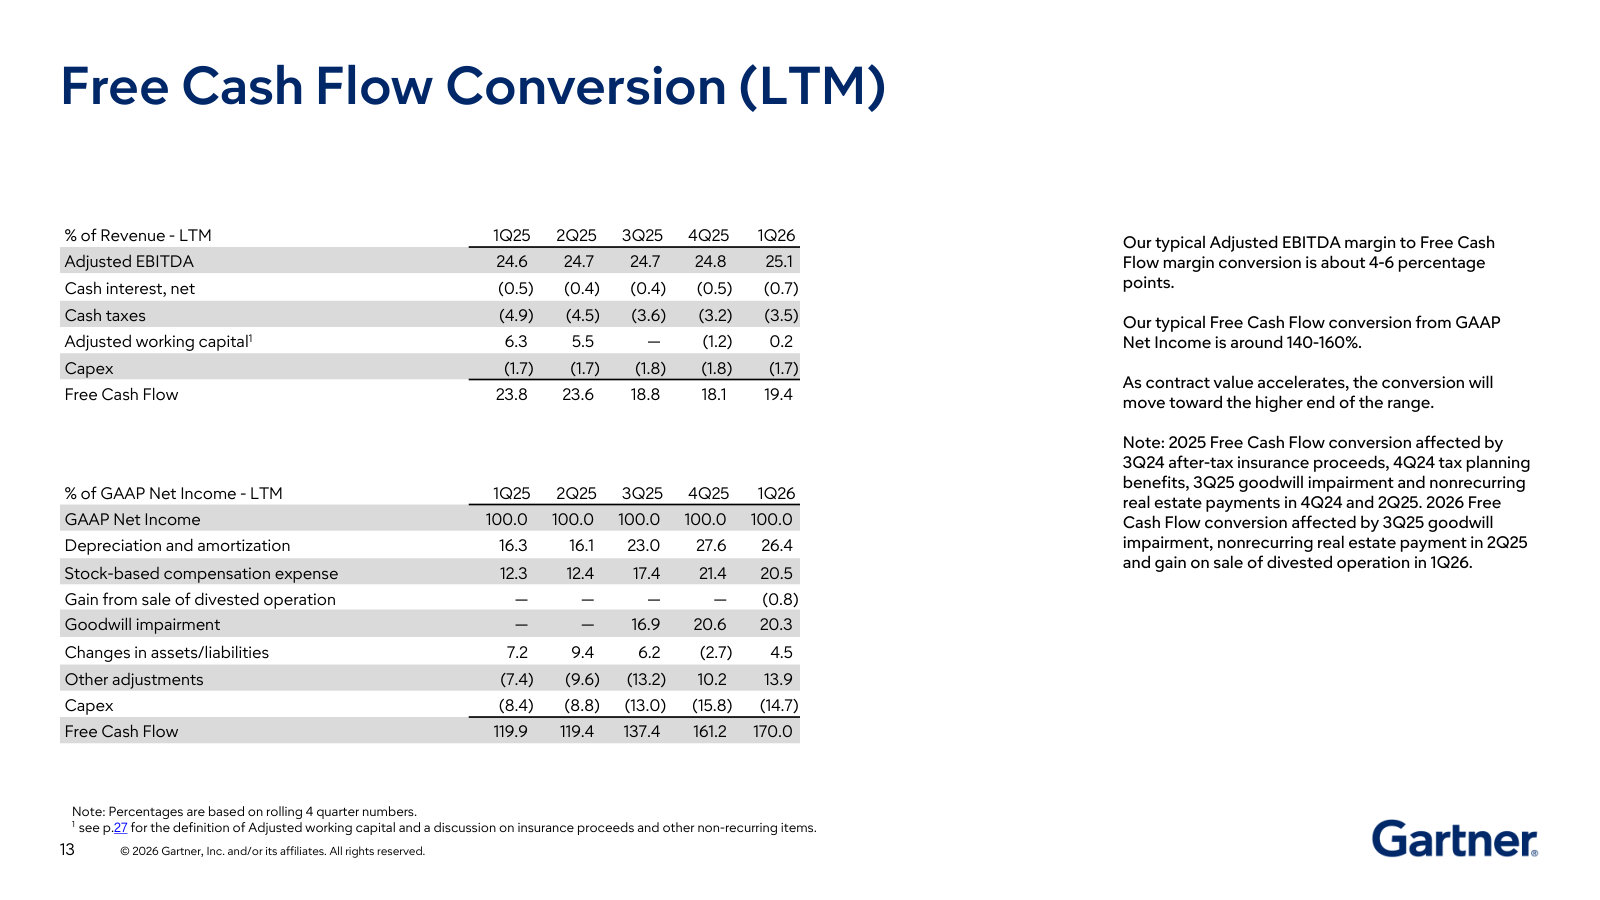
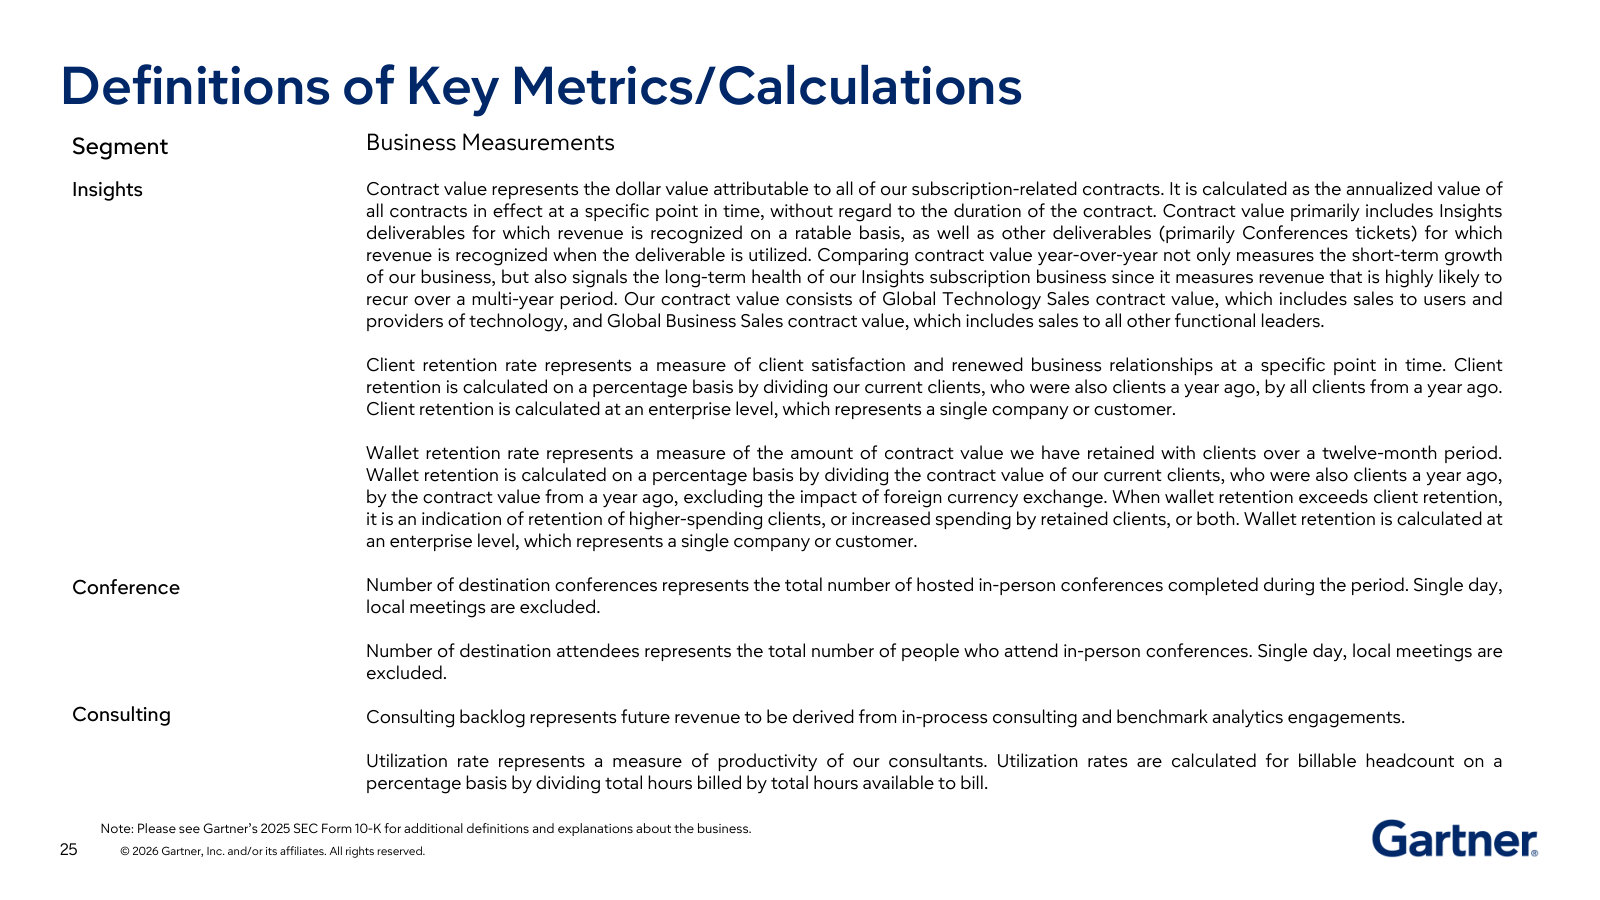
p. 4 — The whole business in one diagram: who Gartner sells to, the objective-insights product, and the flywheel of client interactions and vendor briefings that feeds it. · Open the full presentation →p. 5 — One-page scorecard — contract value, revenue, EBITDA and EPS with the three segments broken out, plus the 2026 guidance frame. · Open the full presentation →p. 6 — 2026 guidance walk, with the bullets that explain the drivers: Insights ~100% subscription, 56 conferences, and where costs are being invested. · Open the full presentation →p. 7 — How the subscription engine actually works: contract value, quota-bearing sales headcount and wallet retention, split into Technology and Business Sales. · Open the full presentation →p. 8 — The land-and-expand detail — net contract value increase, client-enterprise counts, contract value per enterprise and client retention. · Open the full presentation →p. 9 — Insights segment — the ~85% profit engine: five quarters of revenue and a contribution margin running near 78%. · Open the full presentation →p. 10 — Conferences segment — revenue, destination-conference and attendee counts, and the swingy margin that comes with an events business. · Open the full presentation →p. 11 — Consulting segment — the smaller, project-based, people-driven arm: revenue, backlog, billable headcount and utilization. · Open the full presentation →p. 12 — Capital structure and the capital-allocation policy: target leverage, the debt maturity ladder, and buybacks that offset dilution. · Open the full presentation →p. 13 — Why this is a cash machine — how adjusted EBITDA and GAAP net income convert to free cash flow, with the recurring conversion ranges. · Open the full presentation →p. 25 — Glossary that defines the terms the whole deck runs on: contract value, client retention, wallet retention, and the conference and consulting metrics. · Open the full presentation →
Fourth Quarter 2025 Earnings Supplement — Q4 / FY2025 · 33 pages · Full-year 2025 results and the original 2026 guidance that the May deck later raised. · Open →
Fourth Quarter 2024 Earnings Supplement — Q4 / FY2024 · 28 pages · The full-year 2024 baseline behind the segment trends shown in the featured deck. · Open →