Full Report
The numbers behind Gartner, Inc.: as-reported financial statements and company metrics for FY2021–FY2025, traced to the source filings, opened with the share-price history those statements have to justify. Every linked figure opens the exact page of the filing it was printed on, with the statement row highlighted. Amounts in US$ thousands unless noted.
Reading notes: Display unit is US$ thousands, as printed in Gartner's Form 10-K statements ('IN THOUSANDS'). Per-share and share-count rows are in their natural units. Every FY2021–FY2025 cell in the revenue, income, balance-sheet and cash-flow statements is verified to that fiscal year's own Form 10-K (income statement pages 71/67/68/67/73; balance sheets 70/66/67/66/72; cash flows 74/70/71/70/76 for FY2021–FY2025). Revenue segment rename: in Q2 2025 Gartner renamed its 'Research' segment to 'Business and Technology Insights' ('Insights'), and in Q3 2025 moved Gartner Digital Markets into 'Other' (prior periods recast within the FY2025 10-K). FY2021–FY2024 revenue rows are shown as originally reported ('Research', which then still included Digital Markets); the FY2025 'Insights' figure excludes Digital Markets, which appears on the separate 'Other' row. The reported total revenue is unaffected and reconciles each year. Segment Gross Contribution (segment_profit) is shown only for FY2023–FY2025 because the FY2025 10-K's Note 16 recasts those three years onto the current Insights/Other basis (FY2025 on p.131; FY2024 and FY2023 on p.132). Total gross contribution equals consolidated gross profit each year.
Share Price — Full Available History — 33 Years
The stock closed at $140.19 on Jul 17, 2026 — up 34,743% over the window shown (+19.6% a year), trading between $0.39 and $551.80. At that close the stock trades at 15× FY2025 diluted EPS as reported below.
Source: market price feed, monthly closes, sampled from 8,246 source observations, Oct 1993–Jul 2026. Price return only, excludes dividends. Prices are split-adjusted (1:2 on Aug 29, 1994; 1:2 on Jun 29, 1995; 1:2 on Apr 01, 1996).
FY2025 at a Glance
Revenue (US$ thousands)
Operating income (US$ thousands)
Net income (US$ thousands)
Diluted EPS
Source: FY2025 consolidated statements [1] [2] [3] [4]. Click any linked figure to open the filing page with the row highlighted.
Revenue by Segment
| Revenue by Segment | FY2021 | FY2022 | FY2023 | FY2024 | FY2025 |
|---|---|---|---|---|---|
| Insights (Research) | 4,101,392 | 4,604,791 | 4,887,046 | 5,125,650 | 5,072,570 |
| Conferences | 214,449 | 389,273 | 505,164 | 583,224 | 644,743 |
| Consulting | 418,121 | 481,782 | 514,746 | 558,537 | 552,499 |
| Other | — | — | — | — | 227,414 |
| Total revenues | 4,733,962 | 5,475,846 | 5,906,956 | 6,267,411 | 6,497,226 |
| Total revenues growth, derived | — | +15.7% | +7.9% | +6.1% | +3.7% |
Source: Consolidated Statements of Operations — revenue disaggregation (each fiscal year's own Form 10-K) [1] [2] [3] [4]. Click any linked figure to open the filing page with the row highlighted.
Segment Gross Contribution
| Segment Gross Contribution | FY2021 | FY2022 | FY2023 | FY2024 | FY2025 |
|---|---|---|---|---|---|
| Insights gross contribution | — | — | 3,443,731 | 3,696,833 | 3,890,185 |
| Conferences gross contribution | — | — | 253,739 | 281,409 | 322,844 |
| Consulting gross contribution | — | — | 181,501 | 203,292 | 186,430 |
| Other gross contribution | — | — | 156,412 | 96,010 | 68,757 |
| Total gross contribution | — | — | 4,035,383 | 4,277,544 | 4,468,216 |
Source: Note 16 — Segment Information, FY2025 Form 10-K (recast basis) [5] [6]. Click any linked figure to open the filing page with the row highlighted.
Income Statement
Source: Consolidated Statements of Operations, Form 10-K [1] [2] [3] [4]. Click any linked figure to open the filing page with the row highlighted.
Columns marked E are consensus analyst estimates shown alongside reported results for direct comparison; they are not company guidance.
Estimate source: Yahoo Finance analyst consensus, as of 2026-07-19. Estimate figures link to the consensus source, not to filing pages.
Balance Sheet
Source: Consolidated Balance Sheets, Form 10-K [7] [8] [9] [10]. Click any linked figure to open the filing page with the row highlighted.
Cash Flow
Source: Consolidated Statements of Cash Flows, Form 10-K [11] [12] [13] [14]. Click any linked figure to open the filing page with the row highlighted.
Insights — Client Wallet Retention
| Insights — Client Wallet Retention | FY2021 | FY2022 | FY2023 | FY2024 | FY2025 |
|---|---|---|---|---|---|
| GTS client retention | 86.0% | 86.0% | 83.0% | 84.0% | 85.0% |
| GTS wallet retention | 106.0% | 105.0% | 101.0% | 102.0% | 96.0% |
| GBS client retention | 87.0% | 89.0% | 87.0% | 87.0% | 86.0% |
| GBS wallet retention | 115.0% | 112.0% | 107.0% | 106.0% | 99.0% |
Source: company filings [15] [16] [17] [18]. Click any linked figure to open the filing page with the row highlighted.
Insights — Contract Value by Channel (FX-neutral)
| Insights — Contract Value by Channel (FX-neutral) | FY2021 | FY2022 | FY2023 | FY2024 | FY2025 |
|---|---|---|---|---|---|
| Global Technology Sales (GTS) contract value | 3,373,000 | 3,632,200 | 3,747,600 | 4,029,000 | 3,910,000 |
| Global Business Sales (GBS) contract value | 874,000 | 1,028,200 | 1,091,000 | 1,233,000 | 1,245,000 |
Source: company filings [15] [16] [17] [18]. Click any linked figure to open the filing page with the row highlighted.
Segment Gross Contribution Margin
| Segment Gross Contribution Margin | FY2021 | FY2022 | FY2023 | FY2024 | FY2025 |
|---|---|---|---|---|---|
| Insights (Research) gross contribution margin | 74.0% | 74.0% | 74.0% | 74.0% | 77.0% |
| Conferences gross contribution margin | 62.0% | 54.0% | 50.0% | 48.0% | 50.0% |
| Consulting gross contribution margin | 38.0% | 39.0% | 35.0% | 36.0% | 34.0% |
Source: company filings [19] [15] [20] [16]. Click any linked figure to open the filing page with the row highlighted.
Conferences Consulting Operations
| Conferences Consulting Operations | FY2021 | FY2022 | FY2023 | FY2024 | FY2025 |
|---|---|---|---|---|---|
| Conference attendees (destination conferences) | 57,145 | 60,104 | 75,569 | 86,625 | 83,727 |
| Consulting — average billable headcount | 749 | 827 | 934 | 956 | 940 |
| Consulting — consultant utilization | 68.0% | 70.0% | 65.0% | 65.0% | 61.0% |
Source: company filings [19] [20] [21] [22]. Click any linked figure to open the filing page with the row highlighted.
Long-Term Record
| Fiscal year | Total revenue | Operating income | Net income | Diluted EPS | Operating cash flow |
|---|---|---|---|---|---|
| FY2016 | 2,444,540 | 305,141 | 193,582 | 2.31 | 365,632 |
| FY2017 | 3,311,494 | (6,329) | 3,279 | 0.04 | 254,517 |
| FY2018 | 3,975,454 | 259,715 | 122,456 | 1.33 | 471,158 |
| FY2019 | 4,245,321 | 370,087 | 233,290 | 2.56 | 565,436 |
| FY2020 | 4,099,403 | 490,150 | 266,745 | 2.96 | 903,278 |
| FY2021 | 4,733,962 | 915,751 | 793,560 | 9.21 | 1,312,470 |
| FY2022 | 5,475,846 | 1,100,106 | 807,799 | 9.96 | 1,101,422 |
| FY2023 | 5,906,956 | 1,236,894 | 882,466 | 11.08 | 1,155,737 |
| FY2024 | 6,267,411 | 1,156,287 | 1,253,715 | 16.00 | 1,484,922 |
| FY2025 | 6,497,226 | 1,025,711 | 729,231 | 9.65 | 1,290,365 |
Source: consolidated statements across filings; older years from the standardized feed [11] [1] [12] [2]. Click any linked figure to open the filing page with the row highlighted.
Operating KPIs
| KPI | FY2021 | FY2022 | FY2023 | FY2024 | FY2025 |
|---|---|---|---|---|---|
| Insights (Research) total contract value | 3,373,000 | 3,632,200 | 3,747,600 | 4,029,000 | 5,155,000 |
| Number of destination conferences | — | — | — | 51 | 53 |
| Consulting backlog | — | — | — | 187,200 | 173,700 |
Source: company-reported operating metrics [19] [15] [16] [17]. Click any linked figure to open the filing page with the row highlighted.
Analyst Consensus
Current price
Mean target
Median target
High target
Low target
Estimate source: Yahoo Finance analyst consensus, as of 2026-07-19. Estimate figures link to the consensus source, not to filing pages.
Traceability
327 of 352 figures on this page (93%) link to the filing page where they are printed — click a linked figure to open the source PDF at that page with the row highlighted. Unlinked figures come from standardized data feeds or pre-filing years.
Display unit is US$ thousands, as printed in Gartner's Form 10-K statements ('IN THOUSANDS'). Per-share and share-count rows are in their natural units.
Every FY2021–FY2025 cell in the revenue, income, balance-sheet and cash-flow statements is verified to that fiscal year's own Form 10-K (income statement pages 71/67/68/67/73; balance sheets 70/66/67/66/72; cash flows 74/70/71/70/76 for FY2021–FY2025).
Revenue segment rename: in Q2 2025 Gartner renamed its 'Research' segment to 'Business and Technology Insights' ('Insights'), and in Q3 2025 moved Gartner Digital Markets into 'Other' (prior periods recast within the FY2025 10-K). FY2021–FY2024 revenue rows are shown as originally reported ('Research', which then still included Digital Markets); the FY2025 'Insights' figure excludes Digital Markets, which appears on the separate 'Other' row. The reported total revenue is unaffected and reconciles each year.
Segment Gross Contribution (segment_profit) is shown only for FY2023–FY2025 because the FY2025 10-K's Note 16 recasts those three years onto the current Insights/Other basis (FY2025 on p.131; FY2024 and FY2023 on p.132). Total gross contribution equals consolidated gross profit each year.
KPI 'total contract value' is on a foreign-exchange-neutral basis. FY2021–FY2024 values are the Research segment's total contract value as originally reported; in 2025 Gartner expanded the reported Insights total contract value measure to the sum of Global Technology Sales and Global Business Sales contract value, so the FY2025 figure (5,155,000) is not directly comparable to prior years.
FY2016–FY2020 long-term-record figures are from the standardized SEC XBRL data feed and are shown without page links; FY2021–FY2025 long-term rows are linked to the source 10-Ks.
Quarterly cash flows and the Q4 FY25 income-statement column are derived from printed year-to-date statements (see each statement's note); all derivations reconcile exactly to the printed figures and were cross-checked against data/financials/cash_flow_quarterly.json.
1 figure(s) differed between the data feed and the filing; the filing value is shown (see the run's metrics/metrics_tab.json for the audit trail).
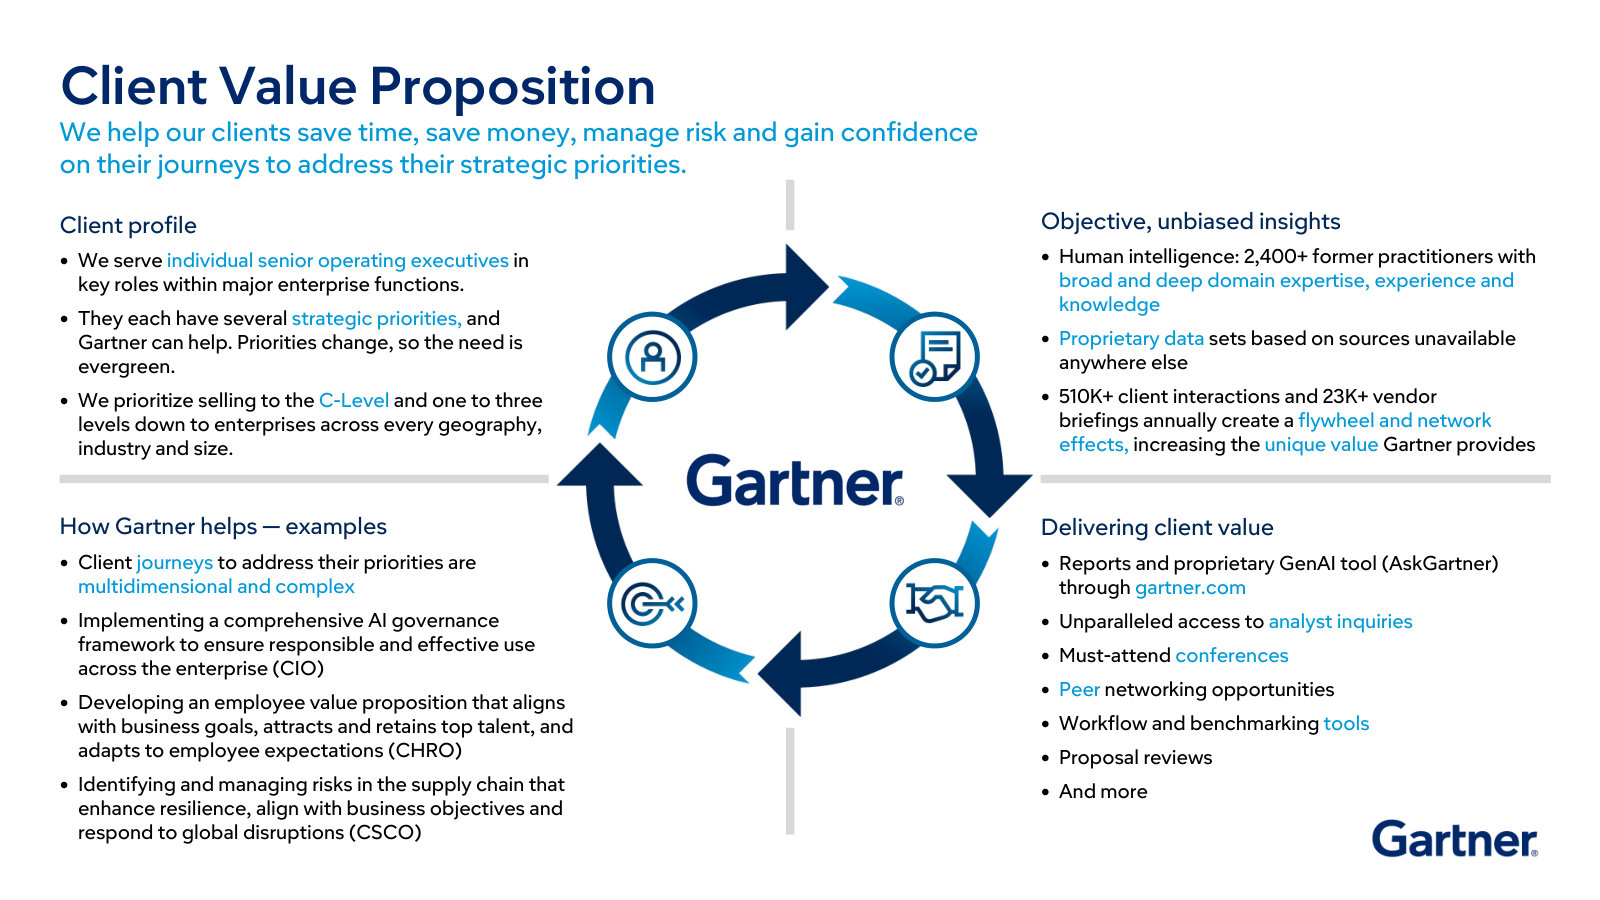
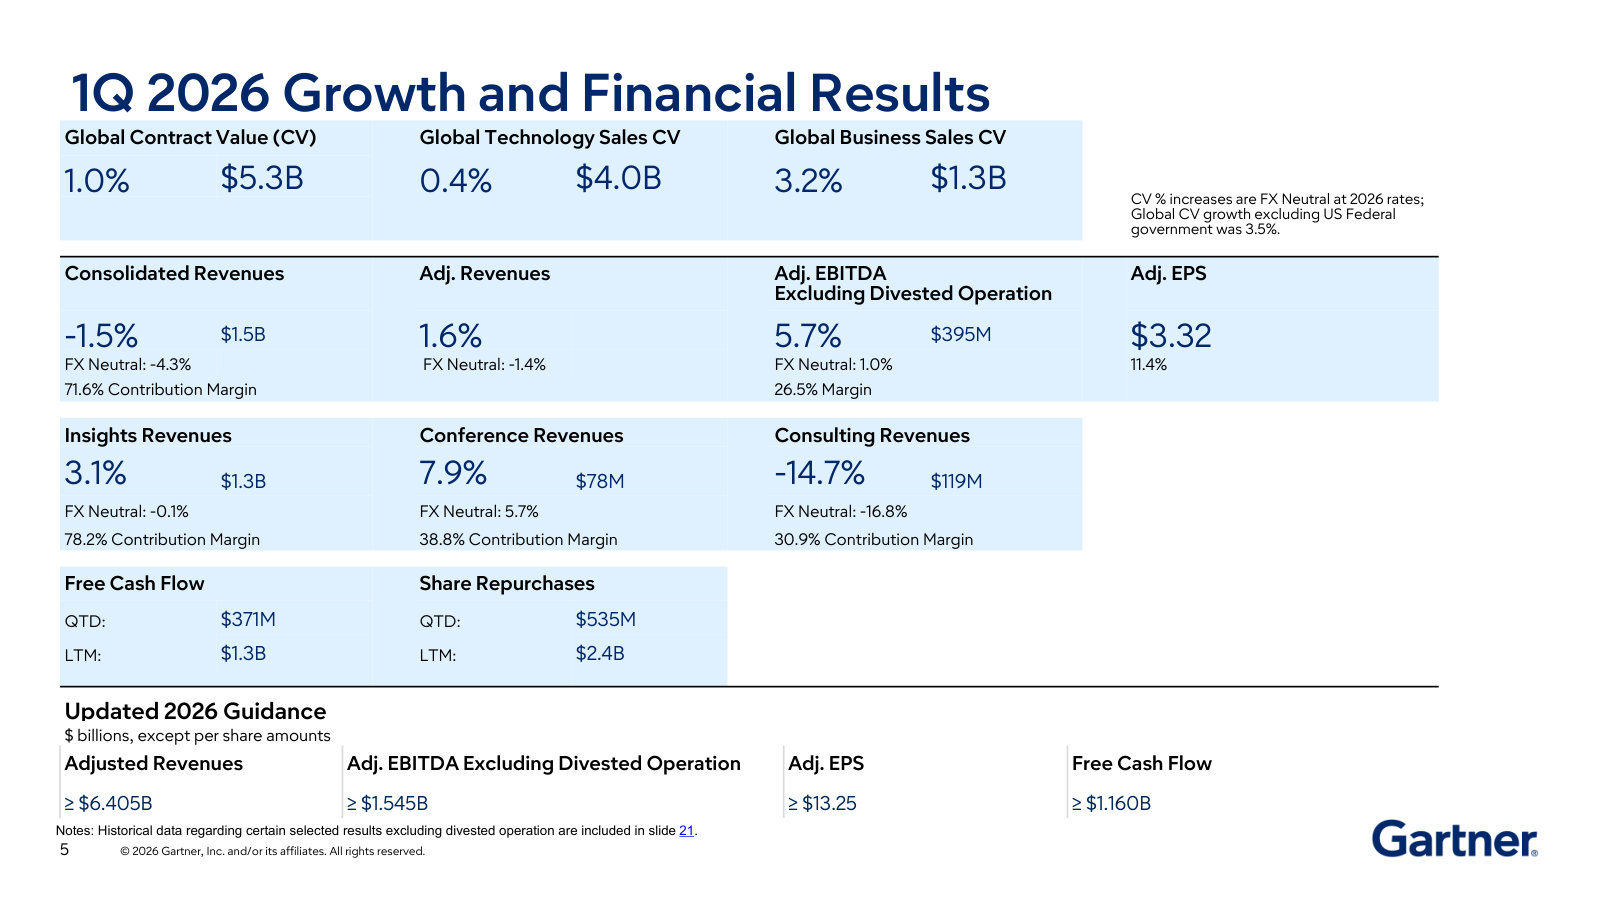
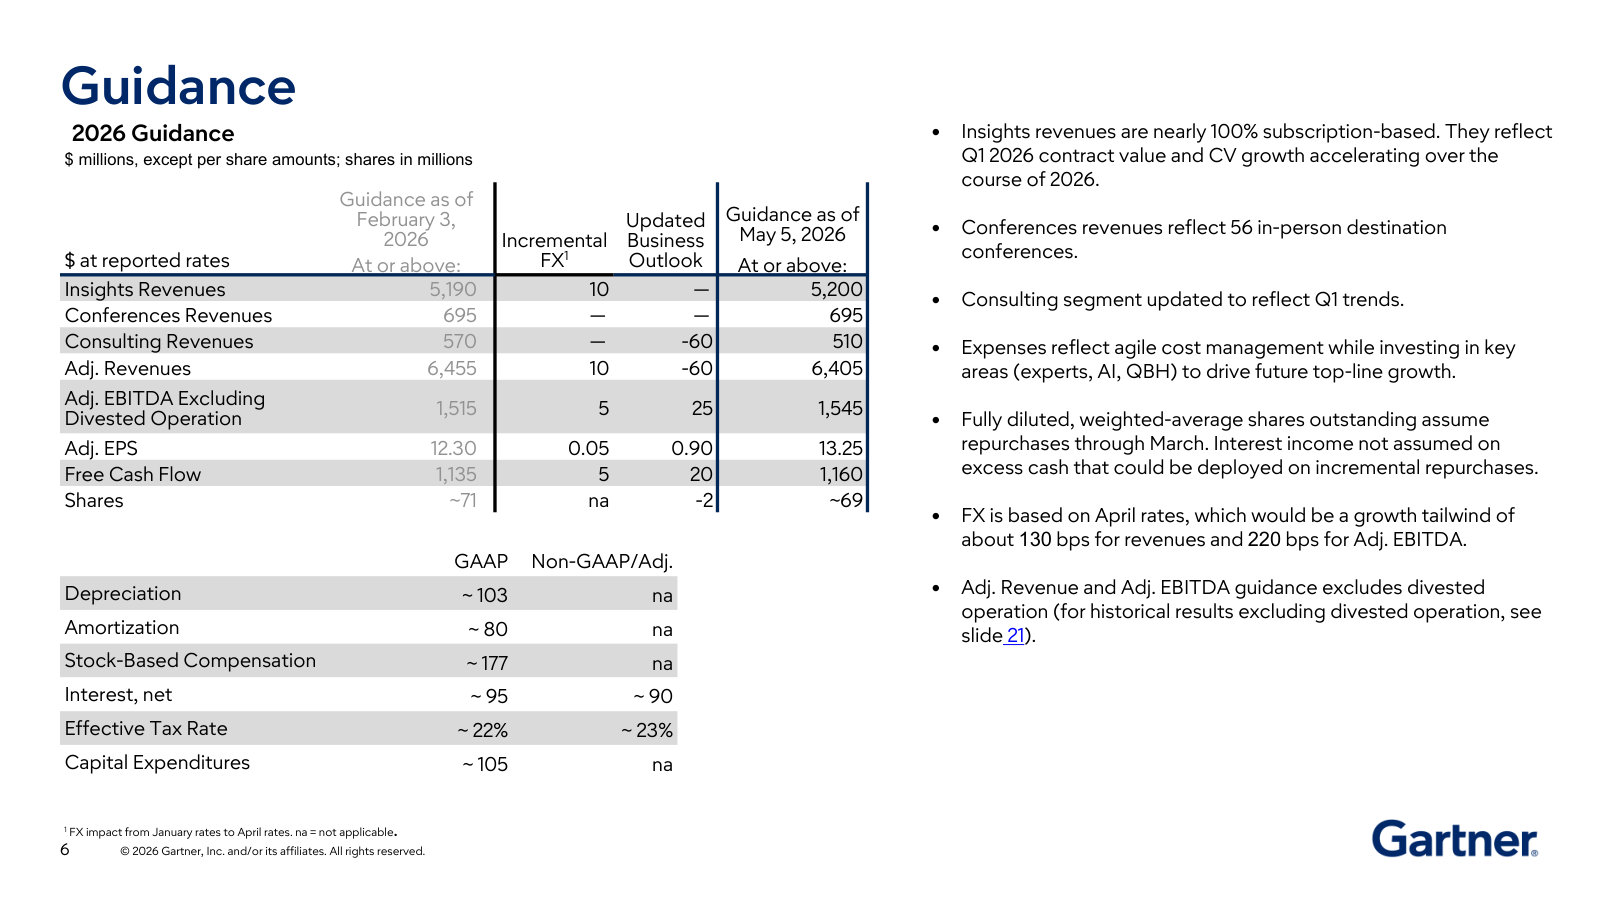
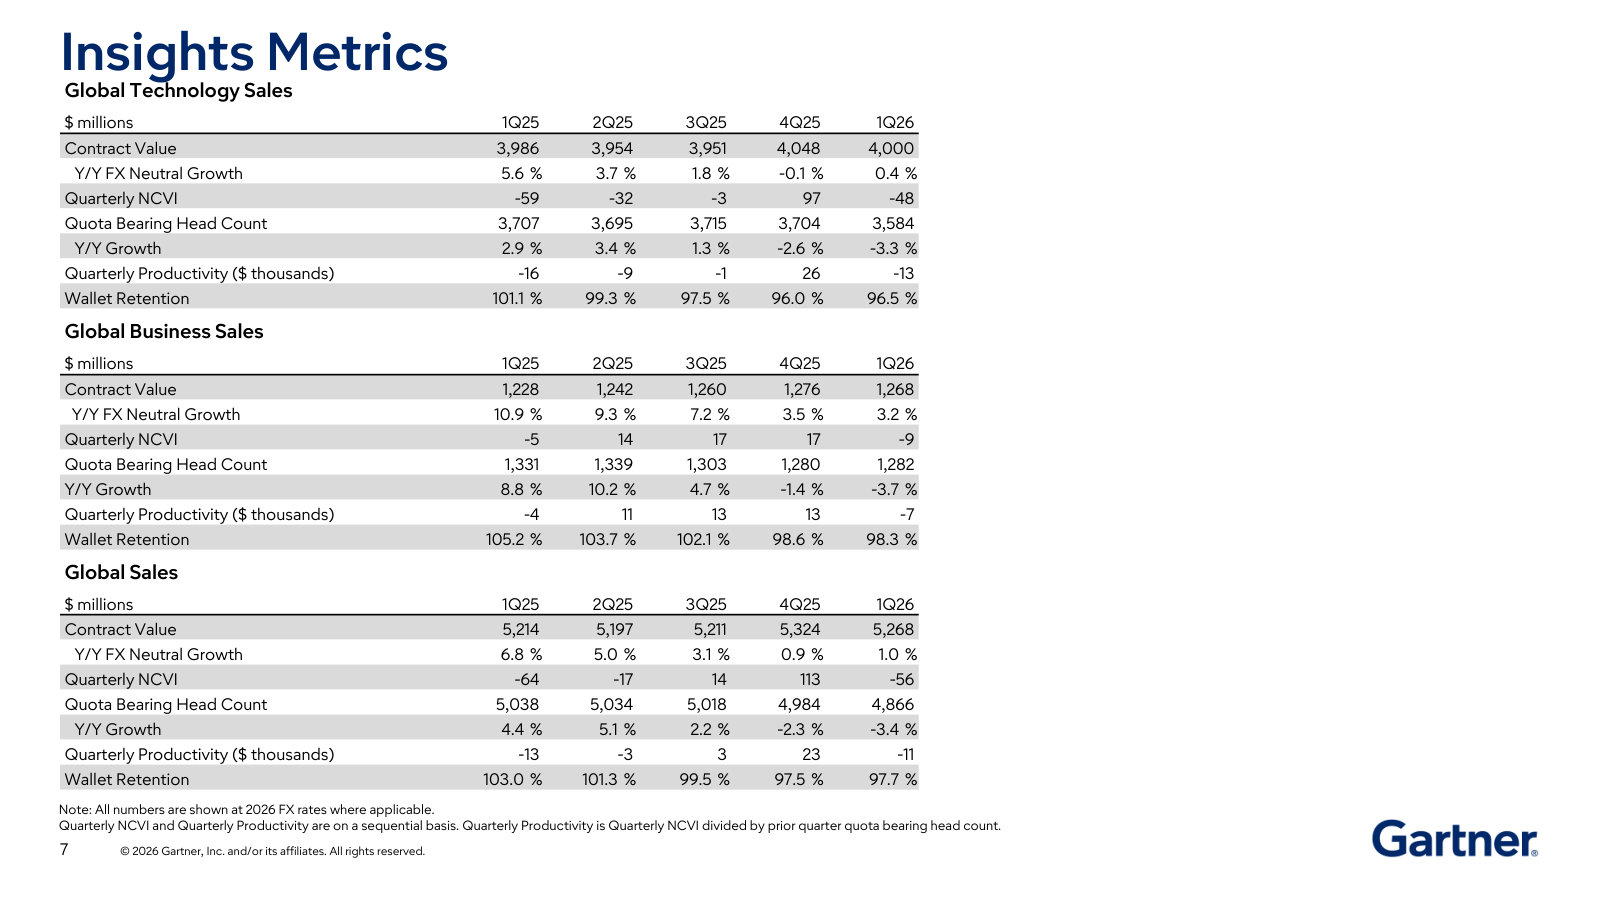
Gartner, Inc.'s management explains the business in its own materials. The slides below do the most of that work, pulled from the documents preserved in Sources. Each source link opens the complete presentation at that slide in a new tab.
First Quarter 2026 Earnings Supplement — Q1 2026
The latest quarterly deck and the fullest self-contained picture Gartner publishes: the client flywheel, all three segments, the subscription unit economics, and capital allocation. · Open the full document →
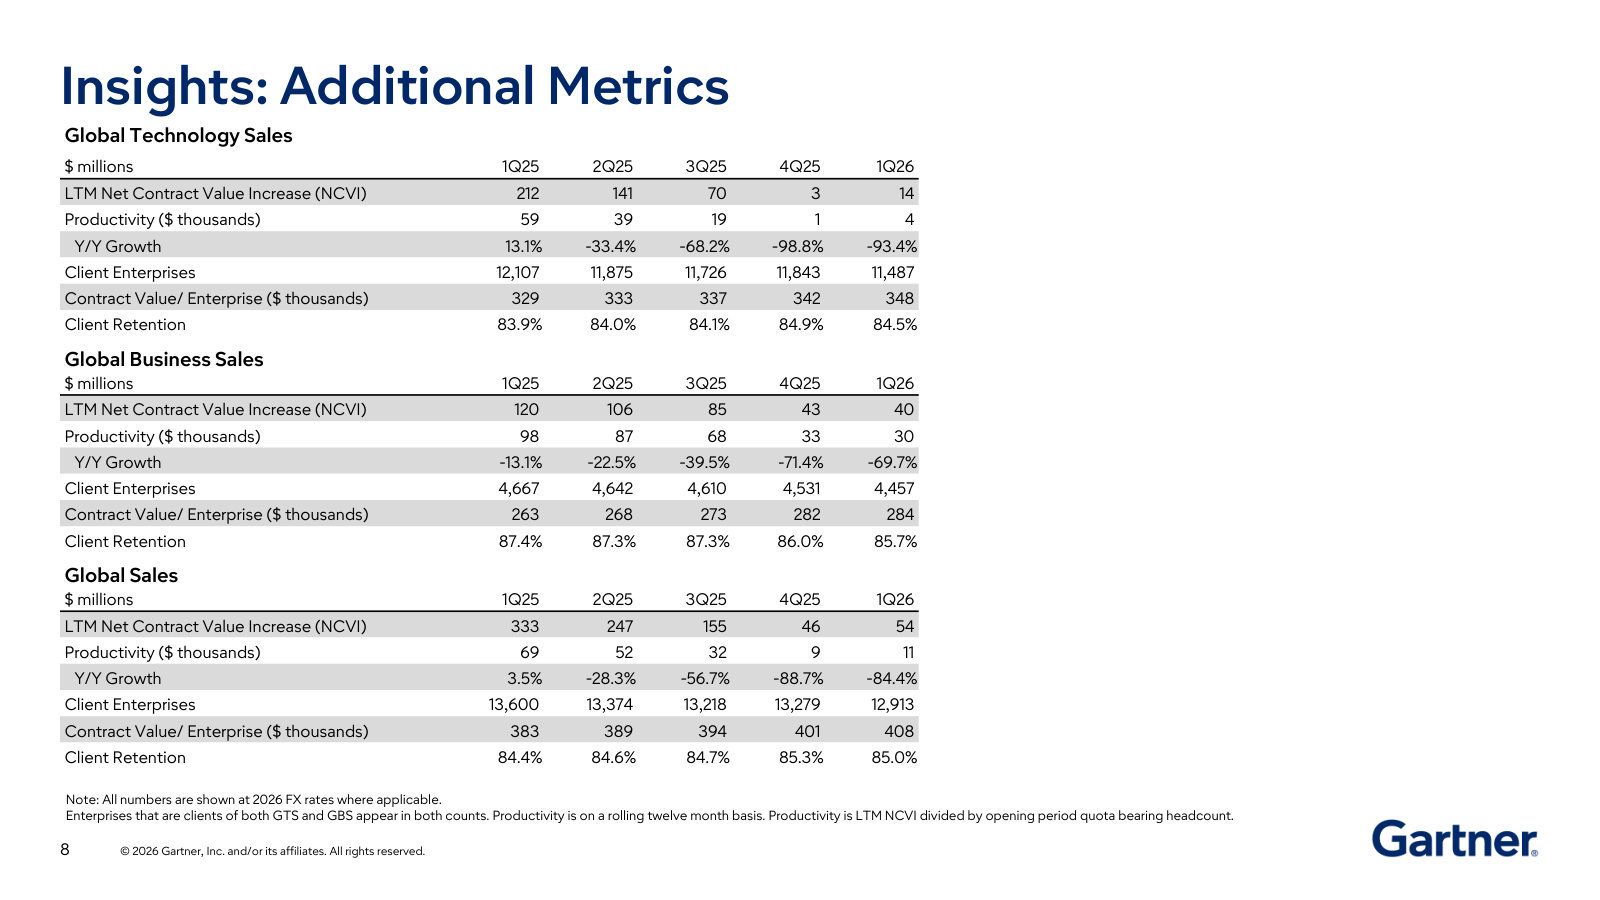
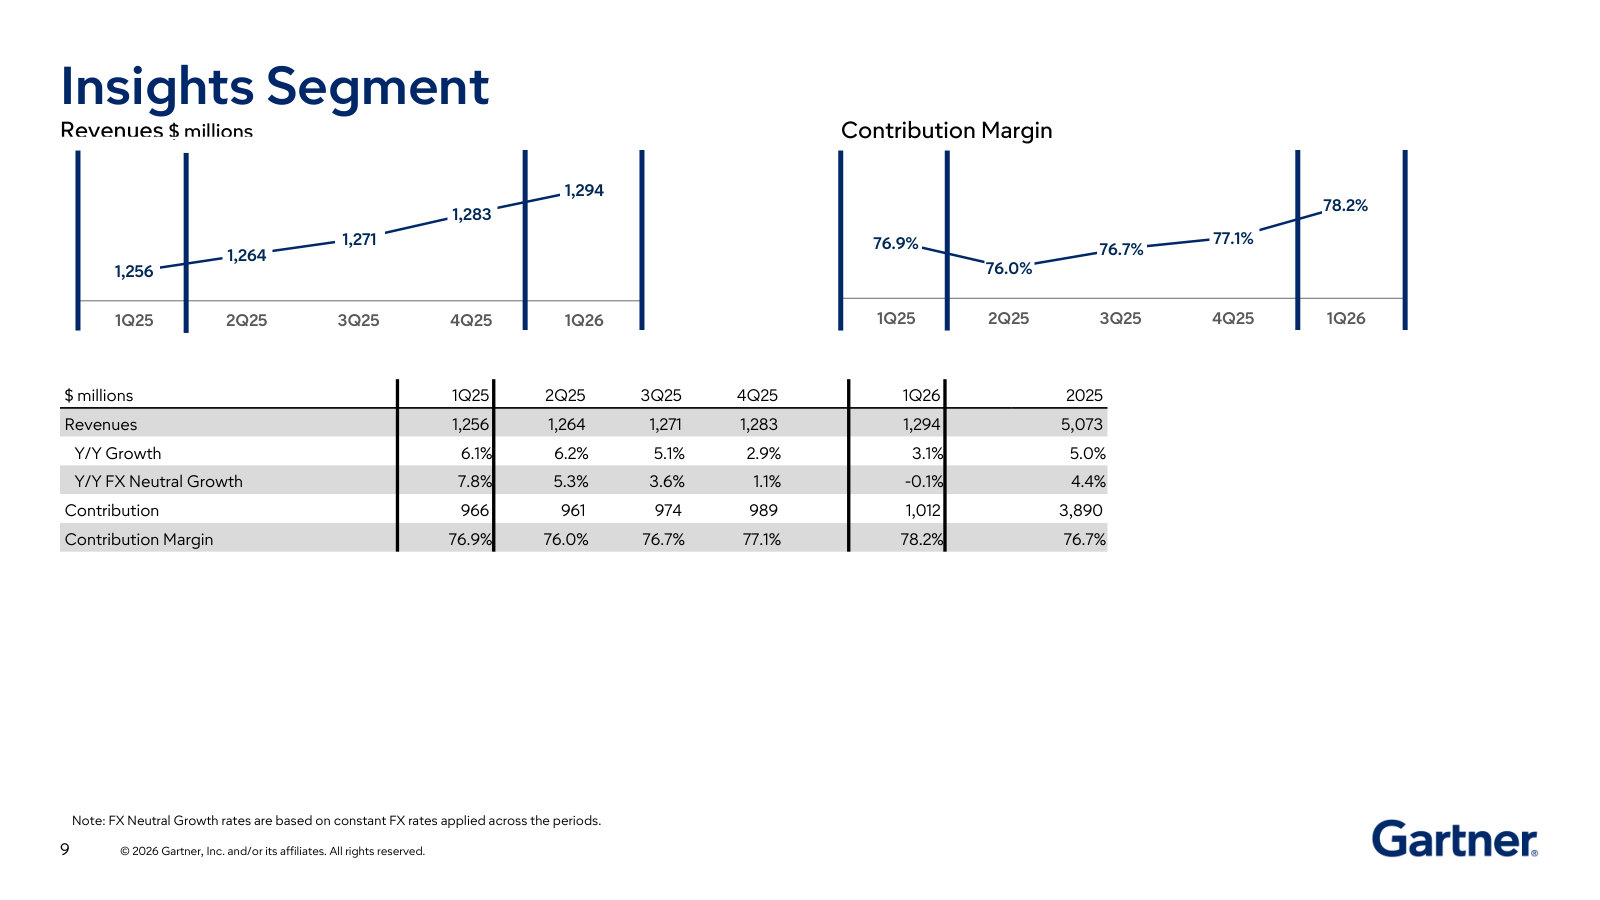
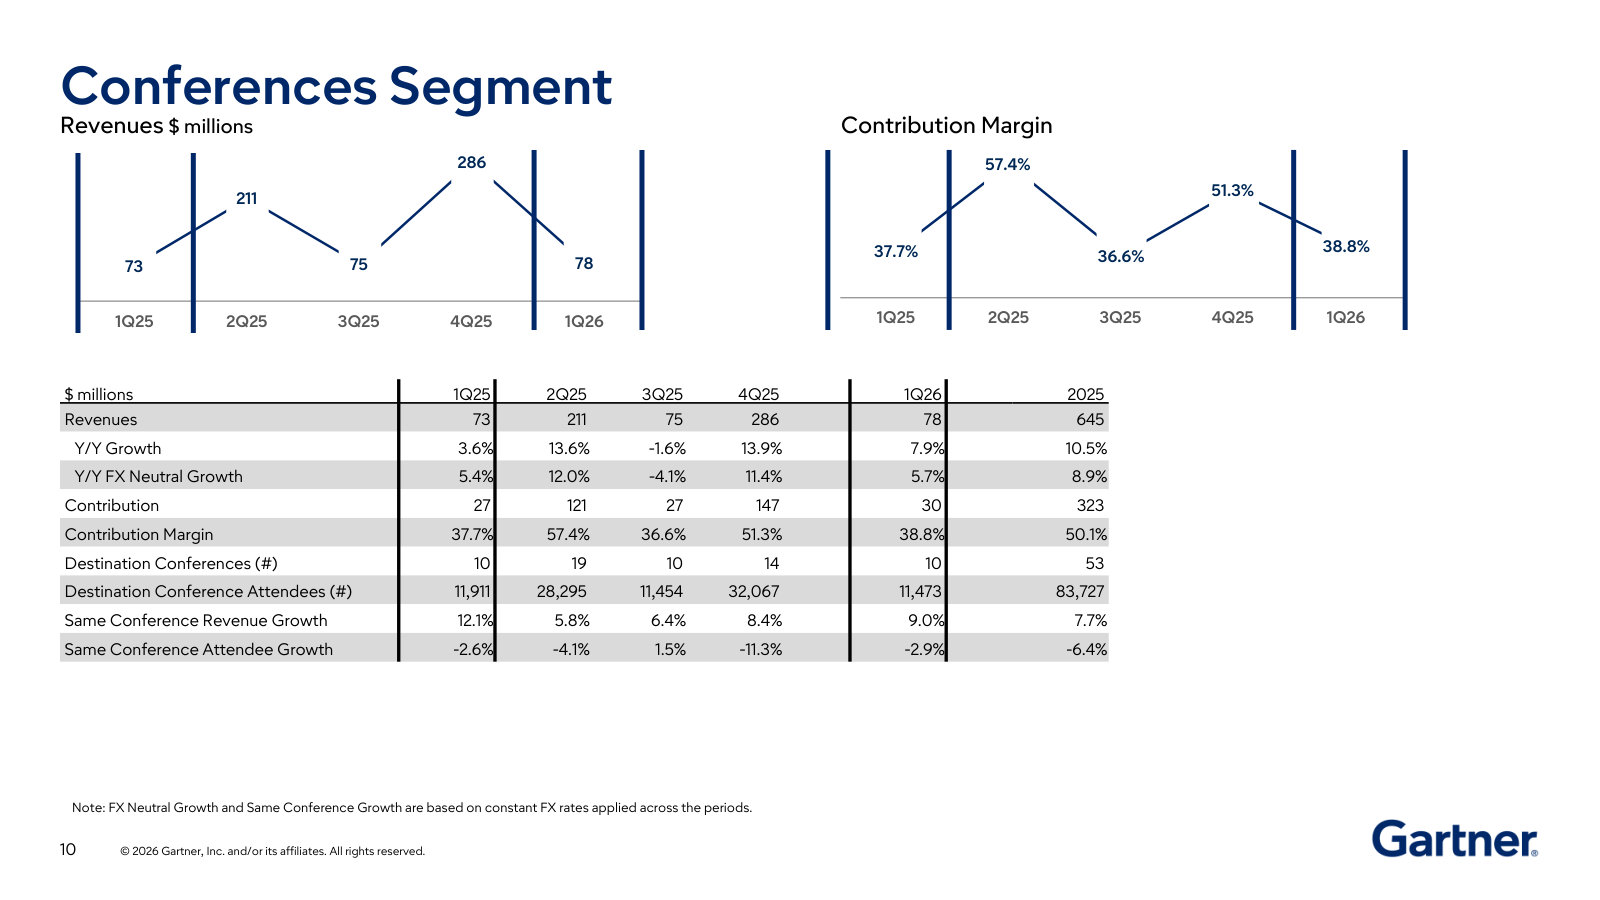
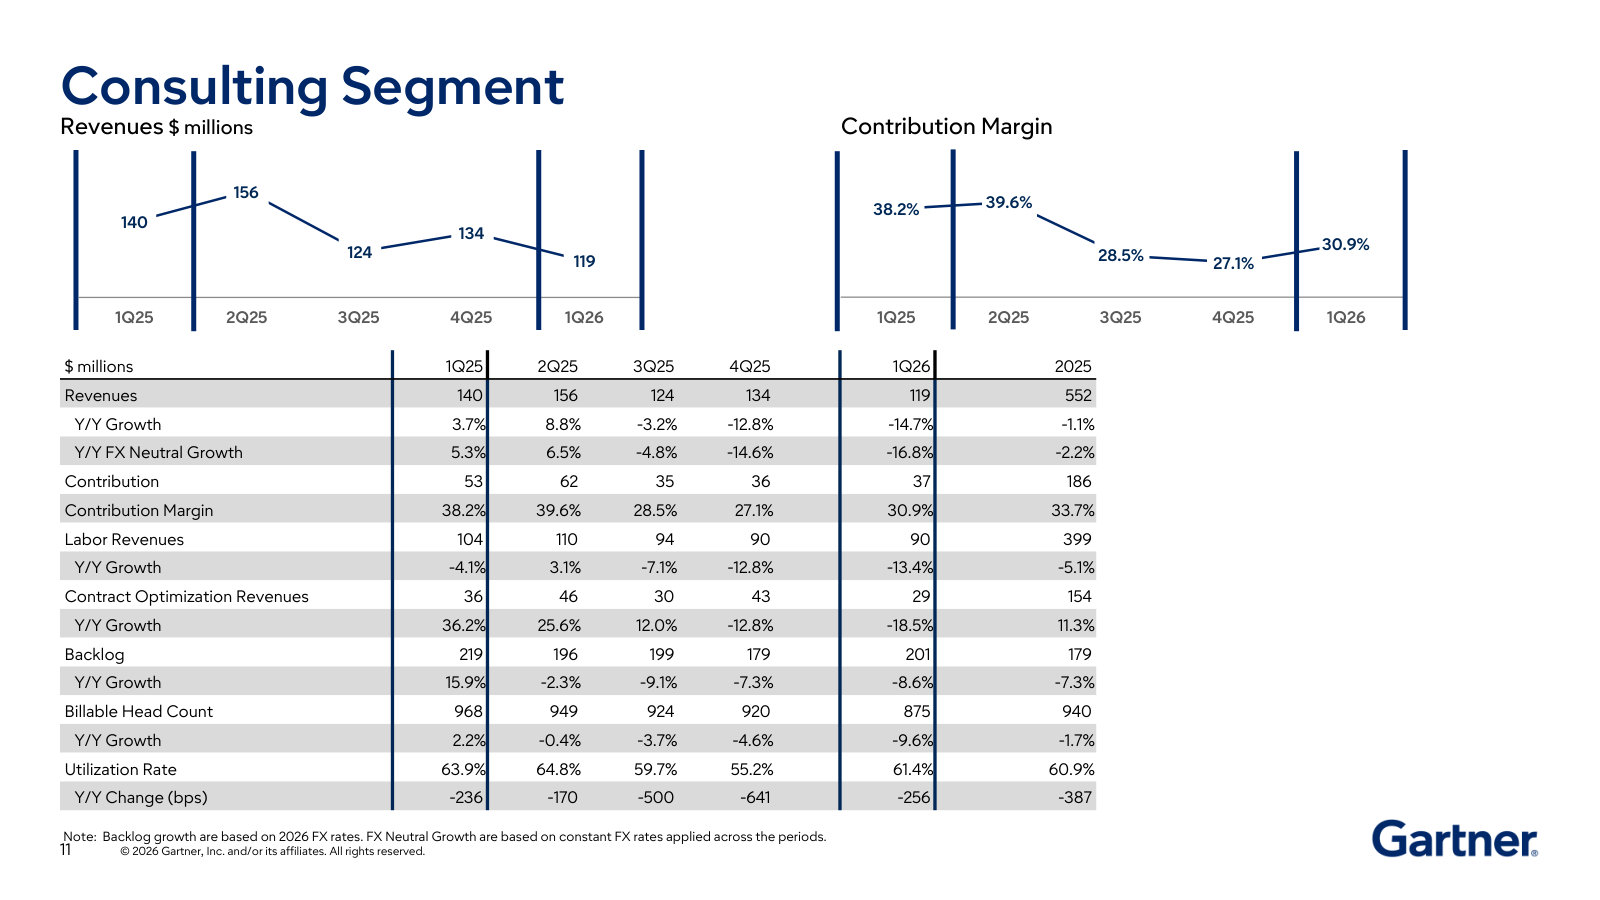
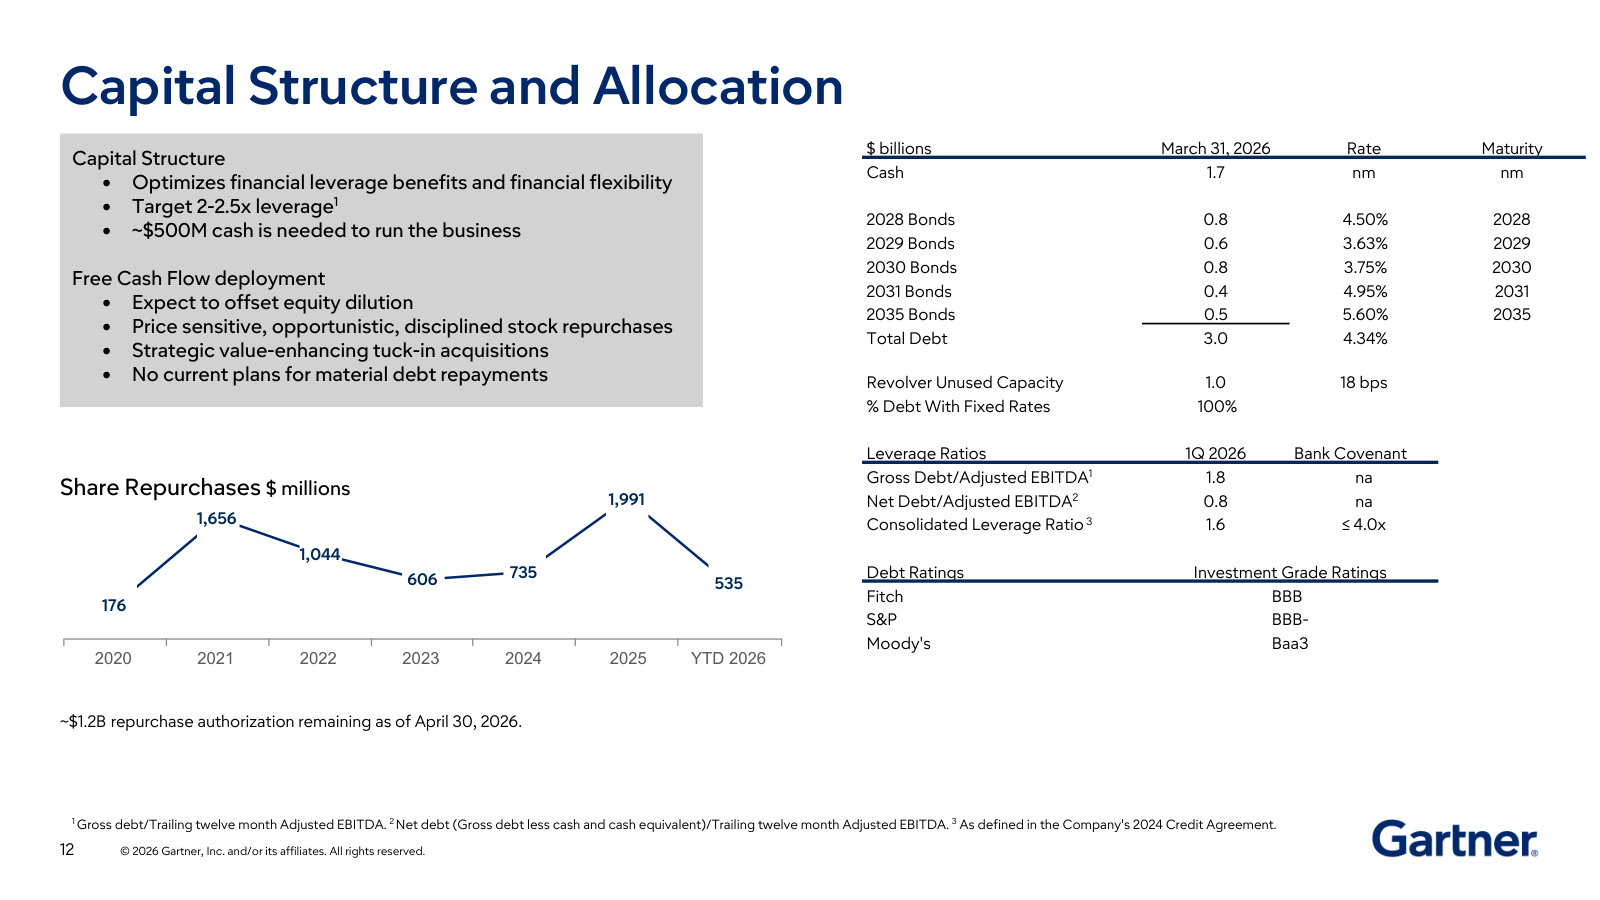
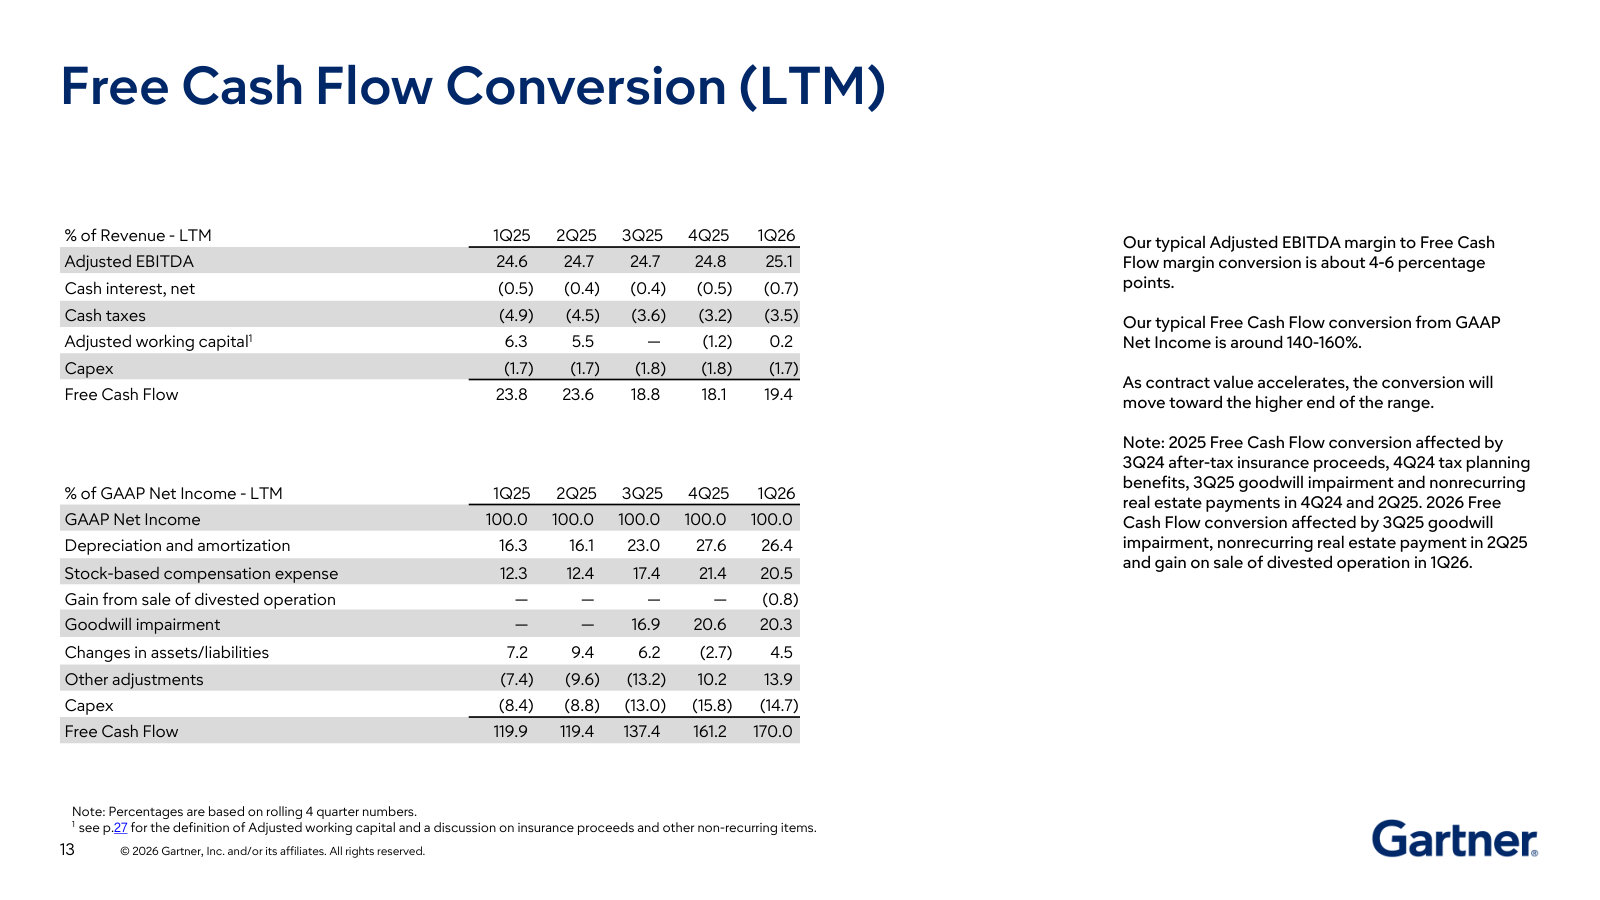
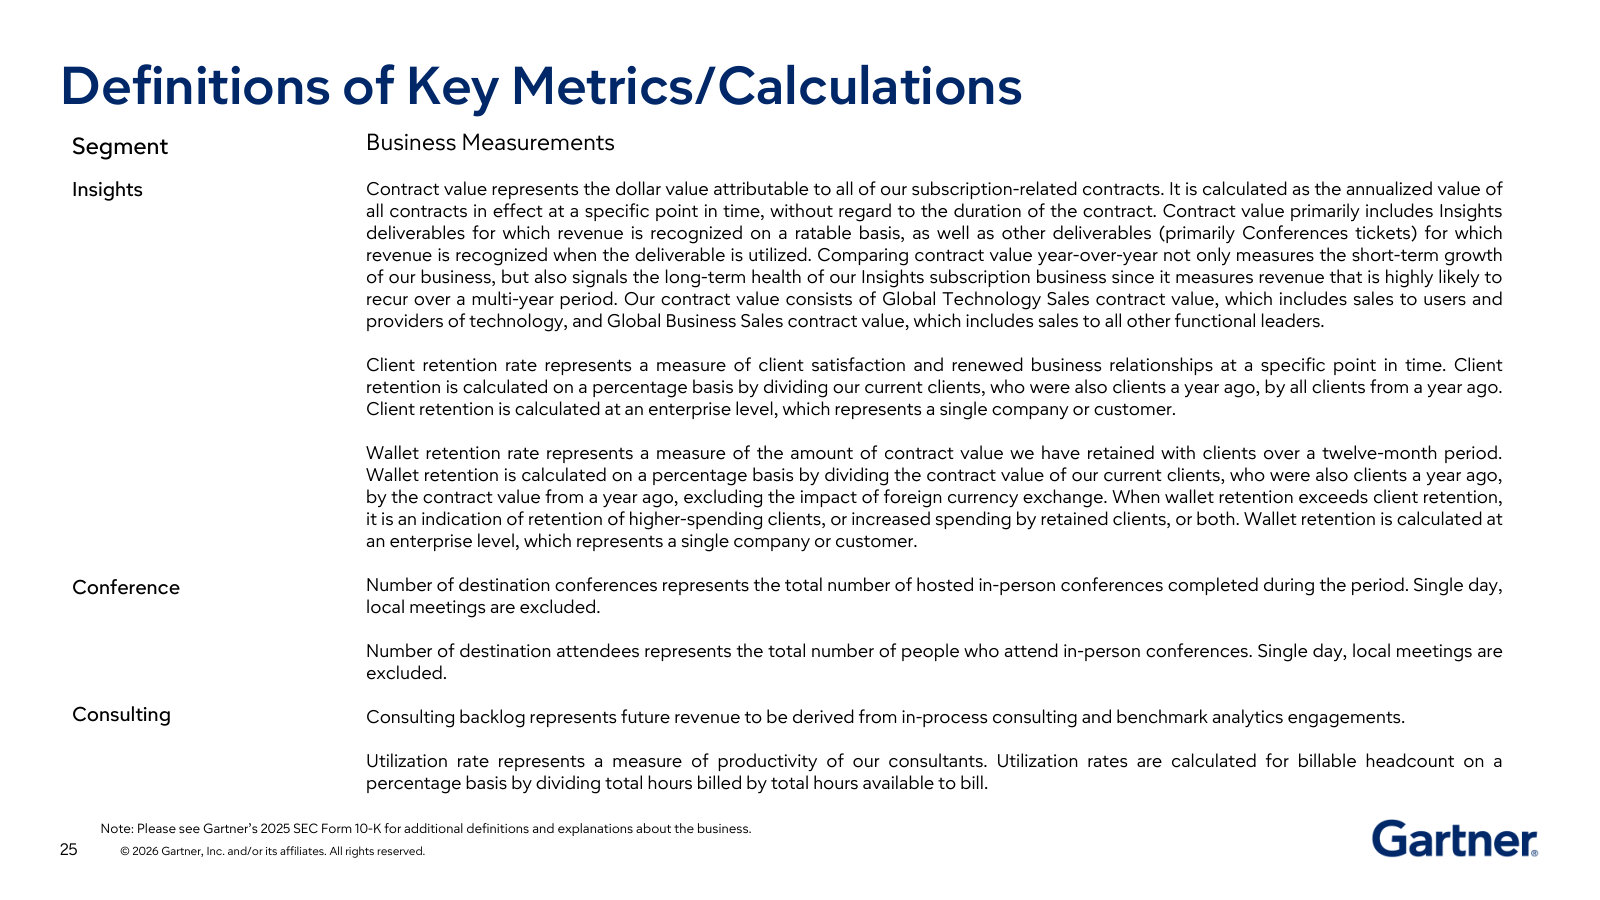
More from management
Fourth Quarter 2025 Earnings Supplement — Q4 / FY2025 · 33 pages · Full-year 2025 results and the original 2026 guidance that the May deck later raised. · Open →
Fourth Quarter 2024 Earnings Supplement — Q4 / FY2024 · 28 pages · The full-year 2024 baseline behind the segment trends shown in the featured deck. · Open →
Gartner, Inc.'s management answers for the business every quarter. These are the exchanges that explain it best — verbatim, from the call transcripts preserved in Sources. Each link opens the full transcript at that page in a new tab.
Q1 2026 Earnings Call — Q1 2026
The cleanest current tour of the model — how insight is manufactured, why pricing holds, the federal drag, the AI-distribution question, and buyback-led EPS growth. · Open the full transcript →
How Gartner manufactures its product: half a million executive conversations a year, distilled into proprietary insight.
Gene Hall (Chairman and Chief Executive Officer (CEO)): Gartner insights are derived from a vast pool of highly proprietary data. Every year, we hold more than 0.5 million two-way conversations with more than 80,000 executives across every major function and in every industry.
p. 1 · Read in context →
The revenue engine in numbers: a $5.3bn contract-value base and ~99% ex-federal wallet retention.
Craig Safian (Chief Financial Officer (CFO)): Contract value was $5.3 billion at the end of the first quarter, up 1% versus the prior year and an acceleration from year-end. Excluding the U.S. federal government, CV growth was 3.5%. […] Global Technology Sales contract value was $4 billion at the end of the first quarter, up versus the prior year. GTS CV for both enterprise leaders and tech vendors increased by more than 3% year-over-year ex Fed. Wallet retention for GTS was 97% for the quarter. Ex Fed, wallet retention was 99%.
p. 3 · Read in context →
Why pricing power holds: Gartner sells to the top of the org chart, where its fee is a small fraction of the budget.
Craig Safian (CFO) and Gene Hall (CEO), responding to Faiza Alwy (Deutsche Bank): it's important to remember who we're targeting and focusing on from a go-to-market and strategy perspective, which is really the top of the org chart in each of the functions we serve. We target the CIO, the CFO or the Chief Supply Chain Officer and their teams. We're starting at the top of the pyramid where there tends to be much less price sensitivity around those services. […] The other thing to think about is that Gartner spend is a very small part of a client's budget. Even our smallest clients have significant revenue, and the incremental difference in Gartner fees is typically a small fraction of their budgets. So price often isn't the primary factor for not buying; it's the broader budget decisions.
p. 6 · Read in context →
How the 12% EPS growth gets made: buybacks doing much of the work — roughly $2.4–2.5bn repurchased in a year.
Joshua Chan (UBS); Craig Safian (CFO): I mean, obviously, revenue growth, at least currently is not probably at that level, so you're going to need some margins or buybacks. […] Over the last 12 months, we've bought back roughly $2.4 to $2.5 billion of stock, reducing the share count significantly. Our intention is to continue share repurchases, which is one of the bigger drivers of that EPS CAGR in addition to revenue and margin expansion.
p. 9 · Read in context →
The runway: roughly 14,000 clients served out of a ~140,000-enterprise addressable market.
Craig Safian (CFO): Given the addressable market — roughly 140,000 enterprises we think could be Gartner clients versus 14,000 we currently serve — the way to capture that incremental market is through business developer investment.
p. 12 · Read in context →
Q4 2025 Earnings Call — Q4 FY2025 (full year 2025)
The strategy laid out in full: the four-dimension insights transformation, the 'assume permanent disruption' pivot, and a direct answer on whether AI substitutes for Gartner. · Open the full transcript →
The business model in three sentences: subscription, paid upfront, cash flow well above net income.
Craig Safian (CFO): The Insight segment is our largest, most important business. It's subscription-based with strong retention, recurring revenue, and excellent contribution margins. We get paid upfront, which allows us to generate strong free cash flow well in excess of net income.
p. 3 · Read in context →
The strategic pivot: assume permanent disruption, refocus on the core insights business, and drive client engagement.
Gene Hall (CEO), responding to Joshua Chan (UBS): During the first half of last year, we came to the conclusion that we should assume that the world is going to be like this forever—that there's going to be a lot more disruption and chaos. We don't know what those things are going to be, but we need to be prepared for them. So to do that, we decided the best way to impact our business was to focus on our core BTI business. On top of that, and within that, the way to optimize that business is to get more client engagement. As I mentioned in my remarks, the more clients engage with us, the higher the retention is.
p. 8 · Read in context →
Inside the factory: how 2,400 analysts and a neural-network model turn hundreds of thousands of client calls into insight.
Jason Haas (Wells Fargo); Gene Hall (CEO): To your point, we have hundreds of thousands of conversations with our clients every year. We also engage with technology vendors, which adds to our body of knowledge. One challenge we have is with our 2,400 analysts; how do we get all the right information to them? As part of this transformation, we've developed very sophisticated systems that let us provide the insights that matter most to the analysts working on particular topical areas like cybersecurity. It starts with the neural network-based system I talked about before. One of the most important decisions we make is determining which content we write on and what insights we want to focus on. This neural network-based system utilizes all of that input and continually updates to show what's trending and what our clients are most interested in.
p. 9 · Read in context →
Straight at the bear case: clients rarely cite AI as a substitute for Gartner — budgets and tariffs are the real drag.
Gene Hall (CEO); Toni Kaplan (Morgan Stanley): I should point out that we've faced a lot of challenges with clients in terms of their internal budgets, but one that we do not hear frequently is, 'They're thinking about using AI in some way as a substitute for Gartner.' If anything, Q4 was less of an issue or less confirmed than even before. But we try to track it very carefully. We're trying to get eyes open about it, and we don't see it as something that is restraining our growth as opposed to clients that have tariffs and budget problems; those are real issues we see every day.
p. 10 · Read in context →
The skeptic's question — why believe the medium-term targets after years of disruption — and management's answer.
Surinder Thind (Jefferies); Gene Hall (CEO): It seems like we've had a number of challenging years where there's always something that disrupts your ability to hit that medium-term guidance. Given the pace of change, what gives you confidence that you can achieve medium-term guidance? It just seems like disruption is in the air at this point. So beyond the current narrative here? […] Because of that, we needed to significantly increase the value we provide clients. So we have a program in place to do it. I mentioned earlier in the call that early indicators are positive. It will take time because, again, clients need to utilize our insights, then come up for renewal, which takes time. It can take a couple of years before we get the full benefit of programs that we’ve just implemented. But I have confidence that our CV will continue to accelerate over that time period due to the changes we’re making.
p. 10 · Read in context →
Q1 2025 Earnings Call — Q1 2025
The call where the thesis was tested — the DOGE-driven US federal shock hit, and management sized it, explained the multiyear-contract cushion, and set out its downturn playbook. · Open the full transcript →
The shock, quantified: ~4% of CV is US federal, nearly all up for renewal in 2025, and only about half of Q1's renewed.
Gene Hall (Chairman and Chief Executive Officer): Gartner has a highly diversified client base. The U.S. federal government represents approximately 4% of our total contract value. Our U.S. federal business has been impacted by the recent policy changes. Nearly all of our U.S. federal contracts are up for renewal in 2025. Roughly 40 of these were transacted in Q1, the largest quarter of the year, and we renewed roughly half that business.
p. 2 · Read in context →
How deep the cut went: dollar retention near 50% on federal contracts, ~80% of the sequential CV decline from that end market.
Craig Safian (Chief Financial Officer): Global CV was $63 million lower than Q4 2024, with around 80% of the change attributable to the U.S. Federal government end market. […] In the first quarter, the dollar retention was almost 50%. At March 31, we had $225 million of U.S. federal CV.
p. 3 · Read in context →
The playbook management leans on: uncertainty delays client decisions, then demand comes back stronger.
Faiza Alwy (Deutsche Bank); Gene Hall (CEO): Historically, we've observed that during periods of uncertainty, clients tend to delay their decision-making. After a few months, they realize they need to navigate the situation, which often leads to a resurgence in activity. […] However, as time passes, they understand they require assistance in areas like cybersecurity, AI, cost optimization, and software selection—all of which are our areas of expertise. This pattern of increasing demand over time is something we've seen consistently.
p. 9 · Read in context →
Contract structure as a shock absorber: multiyear deals can't be cancelled for convenience, and Gartner is pushing more of them.
Jeff Silber (BMO Capital Markets); Craig Safian (CFO): Generally, a multiyear contract represents a long-term commitment with no options for cancellation or termination for convenience. Our multiyear contracts can range from two to five years, though most of them are typically two-year agreements. In contrast, U.S. federal contracts are primarily one-year contracts. Our multiyear contracts are designed to be longterm without any genuine cancellation clauses. We have been actively working to increase the share of multiyear contracts in our overall contract value, particularly during challenging economic conditions. This strategy enhances the resilience of our business, allowing us to mitigate the impact of short-term macroeconomic challenges through a focus on operational best practices like securing multiyear contracts.
p. 11 · Read in context →
More calls
Q3 2025 Earnings Call — Q3 2025 · 12 pages · The trough read on CV growth and the first leading indicators that the insights transformation was lifting engagement and in-quarter renewal rates. · Open →
Q2 2025 Earnings Call — Q2 2025 · 13 pages · A mid-crisis update on the cadence of federal renewals and how tariff-affected industries were behaving through the summer. · Open →
Q4 2024 Earnings Call — Q4 FY2024 (full year 2024) · 12 pages · The last clean pre-shock full-year call — original 2025 guidance and the 12–16% CV / double-digit-revenue medium-term framework, set just before the federal cut. · Open →
Q3 2021 Earnings Call — Q3 2021 · 32 pages · Peak-era mechanics: 14% contract-value growth, GBS wallet retention of 113%, and Gene's clearest explanation of the land-and-expand flywheel (source has web-banner OCR noise). · Open →
Q2 2021 Earnings Call — Q2 2021 · 30 pages · The post-COVID reacceleration and the virtual-conference model, with GBS practices growing north of 20% (source has web-banner OCR noise). · Open →
Q4 2022 Earnings Call — Q4 FY2022 (full year 2022) · 19 pages · How Gartner framed the post-pandemic normalization and the emerging tech-vendor slowdown after the double-digit-growth boom. · Open →
Gartner, Inc.'s annual reports contain management's most considered account of the business. These are the sections, passages and visual pages worth opening in the originals preserved in Sources.
Gartner, Inc. — FY2025 Annual Report (Form 10-K) — FY2025
The latest 10-K: the subscription model, the AI disintermediation risk, a federal-contract shock, and the Digital Markets write-off. · Open the full document →
Item 1. Business — p. 4 · Read the full section →
How Gartner actually works: three segments, a subscription core, and the scale figures that back the moat.
The three segments in management's words, with the subscription and scale metrics behind them.
INSIGHTS. Gartner delivers independent, objective insights to leaders across an enterprise through subscription services that include on-demand access to published content, data and benchmarks, and direct access to a network of more than 2,400 business and technology experts located around the globe. […] We are in steady contact with over 13,000 distinct client enterprises worldwide. We publish tens of thousands of pages of original content annually, and our experts had more than 510,000 direct client interactions in 2025. […] We typically have a minimum contract period of twelve months for our insights subscription contracts and, at December 31, 2025, 77% of our contracts were multi-year. […] During 2025, Gartner successfully held 53 in-person conferences with more than 83,000 attendees, including 12 Symposiums/Xpos.
p. 6 · Read in context →
Item 1A. Risk Factors — p. 12 · Read the full section →
The two risks most specific to Gartner now: AI/LLMs disintermediating its research, and heavy, unwinding government-contract exposure.
The existential risk for a research publisher — AI and LLMs eroding the value of proprietary insight.
Uncertainty in the development, deployment, and use of AI in our platform and products and by our customers and competitors may result in harm to our business and reputation. […] In August 2025, we launched AskGartner, our new AI-powered tool that gives clients an improved user experience by providing faster, more efficient access to our insights, to licensed users globally. […] Our competitors or other third parties may also incorporate AI into their offerings more effectively and/or quickly than we do, which could impair our ability to compete effectively and adversely affect our business and financial results. […] Although generally contractually prohibited, clients or others may load our proprietary information into large language models, which could reduce the value of our offerings.
p. 14 · Read in context →
Item 7. MD&A — Business Overview: Recent Developments — p. 39 · Read the full section →
The year's structural events: federal non-renewals, the Digital Markets goodwill write-off, and the agreement to sell it.
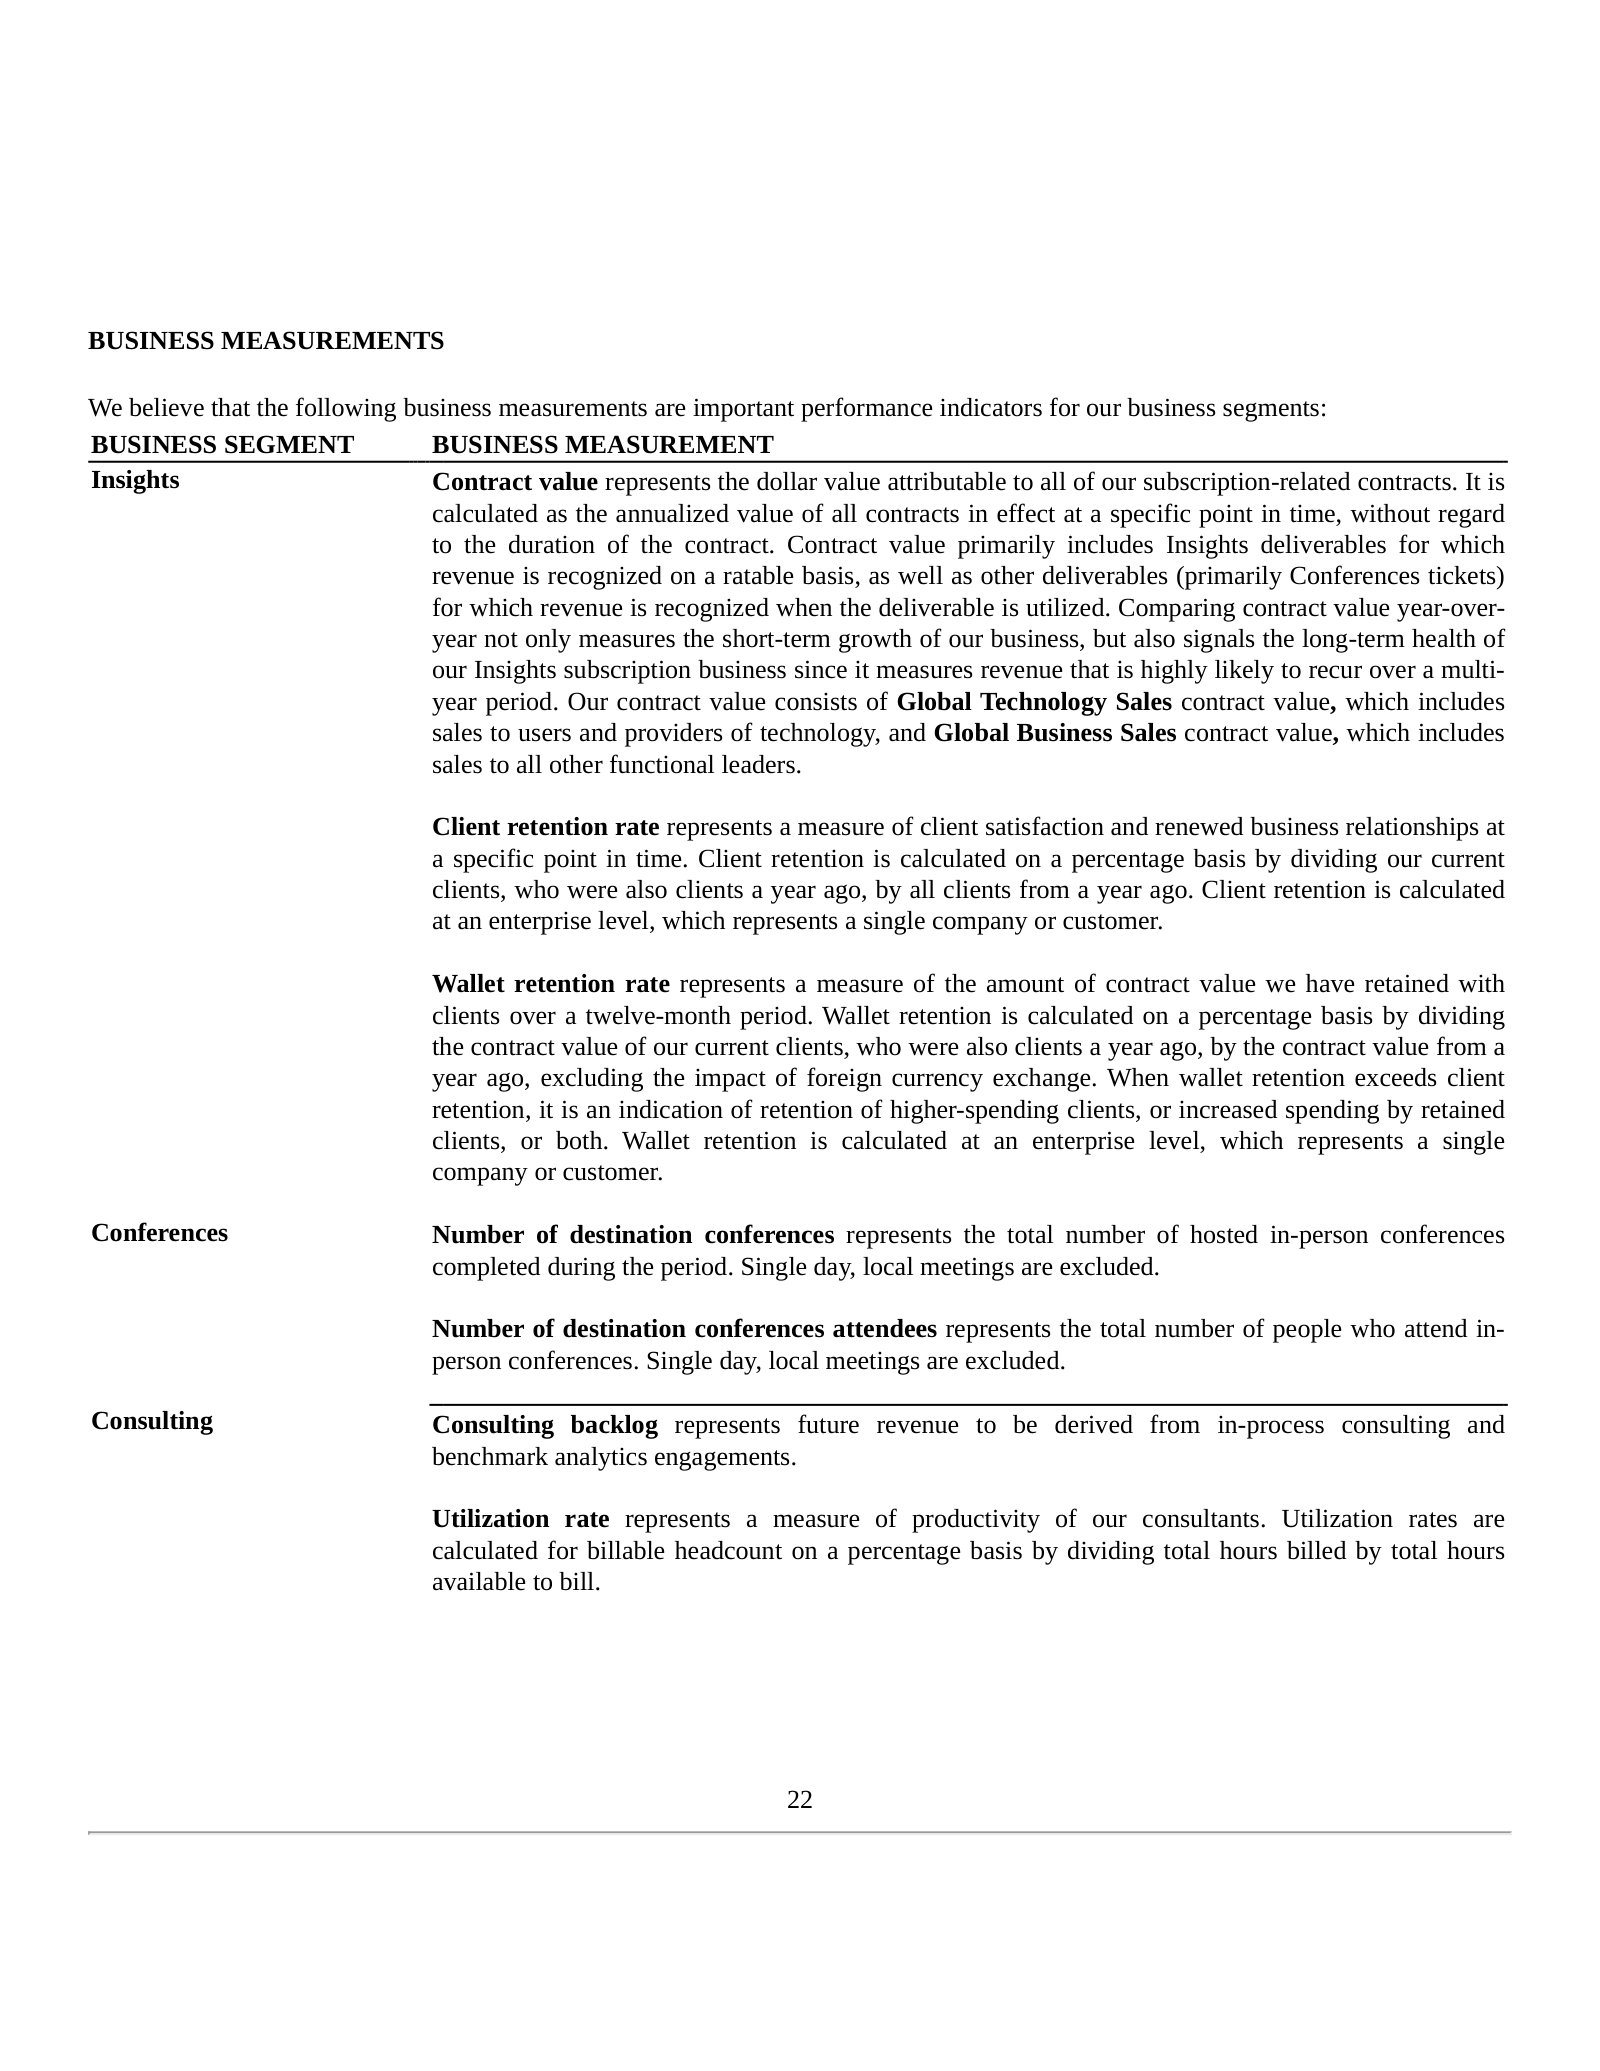
Item 7. MD&A — Business Measurements — p. 41 · Read the full section →
The definitions that make the whole business legible — contract value, client retention, and wallet retention — set out by segment.
Item 7. MD&A — Executive Summary of Operations and Financial Position — p. 42 · Read the full section →
The FY2025 result in management's framing: revenue up 4% but net income nearly halved, and where the cash went.
Revenue $6.5B (+4%); net income falls to $0.7B from $1.3B; contract value $5.2B; $2.0B of buybacks.
We had total revenues of $6.5 billion in 2025, an increase of 4% compared to 2024 on a reported basis and 3% excluding the foreign currency impact. Net income decreased to $0.7 billion in 2025 from $1.3 billion in 2024 and diluted earnings per share was $9.65 in 2025 compared to $16.00 in 2024. The decrease in 2025 is primarily due to the goodwill impairment loss in 2025, the gain on event cancellation insurance claims in 2024 and an increase in the provision for income taxes. […] Contract value was $5.2 billion at December 31, 2025, an increase of 1% compared to December 31, 2024 on a foreign currency neutral basis. […] During 2025, we repurchased 7.0 million shares of the Company’s common stock for an aggregate purchase price of approximately $2.0 billion.
p. 42 · Read in context →
Item 7. MD&A — Results of Operations: Reportable Segments — p. 51 · Read the full section →
The Insights segment KPI table where the softening shows: wallet retention fell sharply even as contract value inched up.
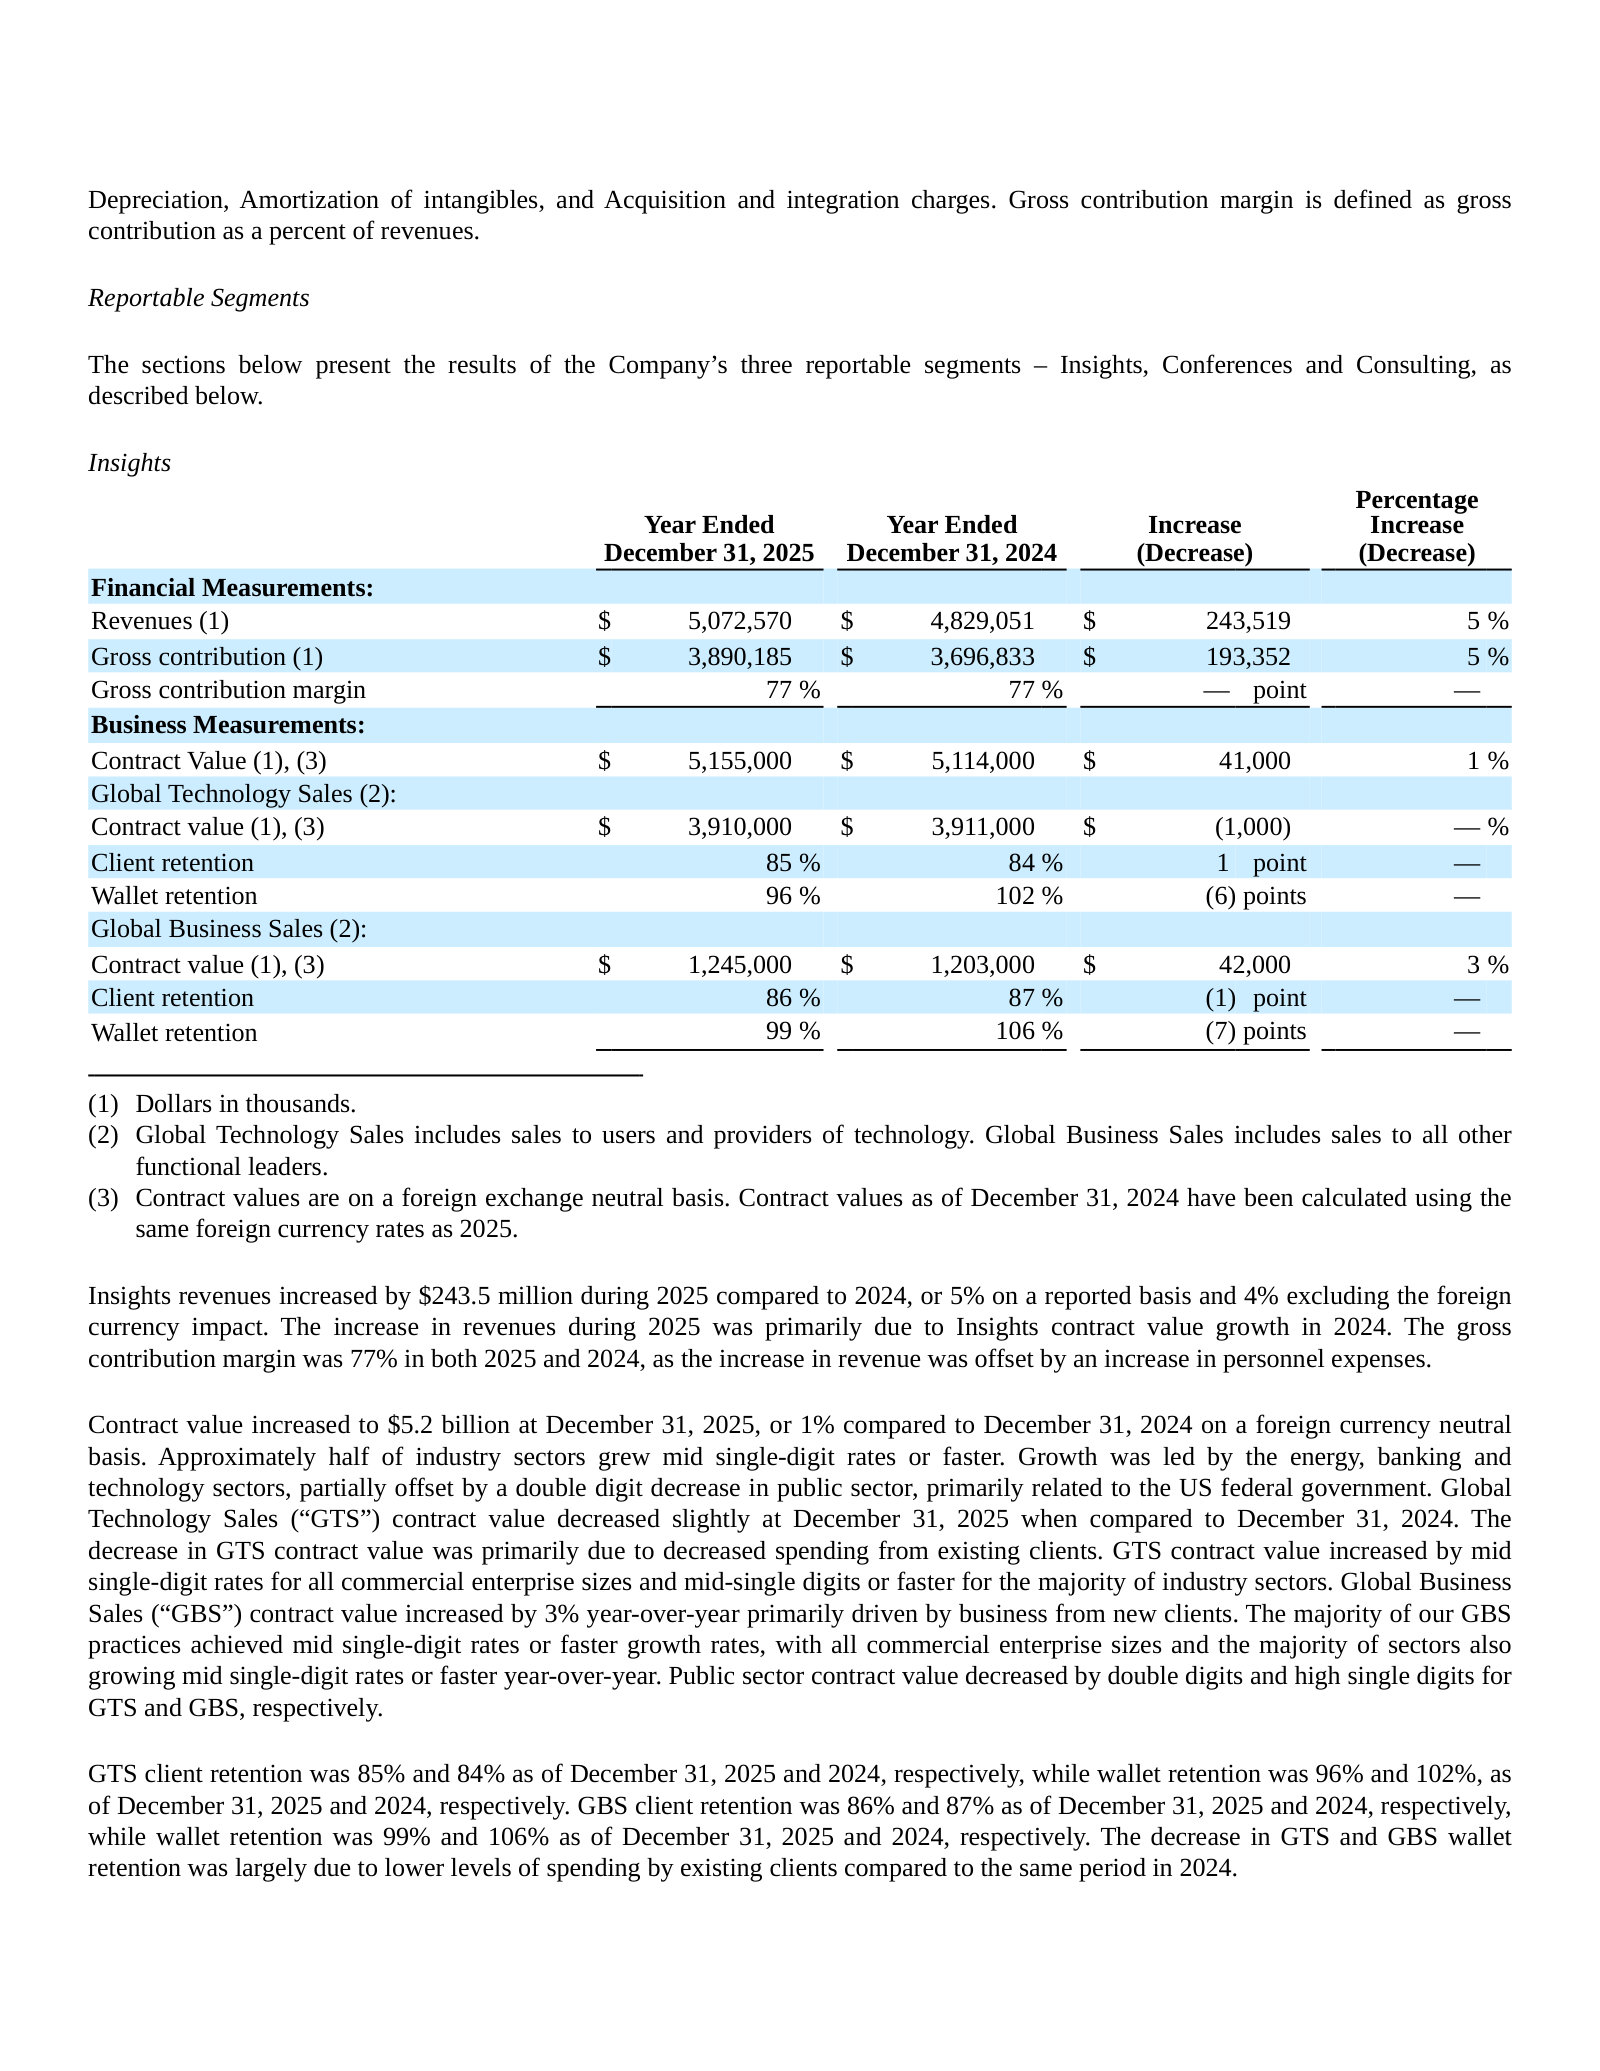
Contract value +1% FX-neutral, but wallet retention drops to 96% (GTS) and 99% (GBS) on lower client spend.
Contract value increased to $5.2 billion at December 31, 2025, or 1% compared to December 31, 2024 on a foreign currency neutral basis. […] Growth was led by the energy, banking and technology sectors, partially offset by a double digit decrease in public sector, primarily related to the US federal government. […] GTS client retention was 85% and 84% as of December 31, 2025 and 2024, respectively, while wallet retention was 96% and 102%, as of December 31, 2025 and 2024, respectively. […] The decrease in GTS and GBS wallet retention was largely due to lower levels of spending by existing clients compared to the same period in 2024.
p. 51 · Read in context →
Note 9 — Revenue and Related Matters — p. 101 · Read the full section →
The subscription model on the balance sheet: a multi-year backlog and deferred revenue that make future revenue highly visible.
Gartner, Inc. — FY2021 Annual Report (Form 10-K) — FY2021
Included for one contrast: the pre-rename segment structure and a larger client base, showing how the business has been redefined since. · Open the full document →
Item 1. Business — p. 4 · Read the full section →
Four years on: the lead segment was 'Research' (renamed 'Insights' in 2025) and the client base was 15,000+, versus 13,000 today.
FY2021: 'Research, Conferences and Consulting' and 'more than 15,000 enterprises' — both since changed.
We are a trusted advisor and an objective resource for more than 15,000 enterprises in approximately 100 countries and territories— across all major functions, in every industry and enterprise size. […] Gartner delivers its products and services globally through three business segments – Research, Conferences and Consulting, as described below. […] Research equips executives and their teams from every function and across all industries with actionable, objective insight, guidance and tools.
p. 4 · Read in context →
More annual reports
Gartner, Inc. — FY2024 Annual Report (Form 10-K) — FY2024 · 127 pages · The prior year, before the impairment and federal shock — includes the $300M event-cancellation insurance gain flattering the FY2024 base. · Open →
Gartner, Inc. — FY2023 Annual Report (Form 10-K) — FY2023 · 128 pages · Mid-cycle edition still under the 'Research' segment naming, useful for tracing the retention and contract-value trend. · Open →
Gartner, Inc. — FY2022 Annual Report (Form 10-K) — FY2022 · 127 pages · First full post-pandemic year, when demand and conferences normalized after COVID. · Open →
Competitors describe Gartner, Inc.'s market in their own filings and calls. These verified passages and visual pages show where their strategies meet, using source documents preserved in Sources.
Forrester Research (FORR)
The most direct pure-play rival — the other independent provider of syndicated research and advisory services, sold on a subscription 'Contract Value' model. Forrester's own 10-K names Gartner as its principal direct competitor.
Forrester's 10-K names Gartner as its principal direct competitor in the market for research and advisory services, and concedes some rivals have 'substantially greater financial and marketing resources' — a nod to Gartner's larger scale.
We compete principally in the market for research and advisory services, with an emphasis on customer behavior and customer experience, and the impact of technology on our clients’ business and service models. Our principal direct competitors include other independent providers of research and advisory services, such as Gartner, as well as marketing agencies, general business consulting firms, and survey-based general market research firms. Some of our competitors have substantially greater financial and marketing resources than we do.
p. 13 · Read in context →
Forrester's stated defense of the syndicated-research model against AI: its proprietary 'Izola' model answers only from Forrester's own research — content it says the public LLMs cannot reproduce. The same disintermediation question Gartner faces.
George Colony, CEO: Izola is a model built by Forrester that yields answers based on Forrester's research. This content is not available in any other generative model, including the public large language models such as Claude from Anthropic, ChatGPT from OpenAI, and Gemini from Google.
p. 2 · Read in context →
Forrester's subscription KPIs — the direct analogues to Gartner's ASV and retention metrics — with wallet retention at 89% and Contract Value still contracting (down 3%), a read on how the pure-play research model is faring.
George F. Colony, CEO & Chairman: Wallet retention improved by two points from last quarter to 89%, which is up three points from the previous year. Client retention improved by one point from the prior quarter to 78%, up five points from the prior year. […] On the CV side, we saw a decline of 3%, an improvement on the 6% decline in 2025.
p. 1 · Read in context →
Information Services Group (ISG) (III)
A technology research and advisory firm whose ISG Provider Lens vendor-evaluation research and benchmarking collide head-on with Gartner's Magic Quadrant / vendor-selection advisory franchise; explicitly claims the 'technology research and advisory services market.'
ISG quantifies the vendor-evaluation franchise that competes with Gartner's Magic Quadrant / vendor-selection work: 180,000+ monitored contracts and 4,000+ providers evaluated annually, with buyers relying on ISG Research to assess potential partners.
ISG monitors over 180,000 unique technology service contracts and annually evaluates more than 4,000 service and software providers, offering valuable insights into pricing, capabilities, and provider stability. When large organizations seek to assess potential partners, they rely on ISG Research for thorough evaluations of capabilities, pricing structures, breadth of offerings, and historical performance.
p. 11 · Read in context →
ISG reports double-digit growth in its research business, led by ISG Provider Lens provider-evaluation research and events — the Gartner-style syndicated-research and conference model, with AI content demand rising.
Our ISG Research business delivered double-digit growth, led by our ISG Provider Lens® provider evaluation research and ISG Events. Client interest in AI-related content continues to rise, evidenced by our five sold-out AI Impact Summit events held across the globe in 2025.
p. 49 · Read in context →
ISG's CEO claims the 'technology research and advisory services market' — Gartner's home turf — and sizes its influence at more than $200 billion of annual tech spend informing its research and benchmarking.
Michael P. Connors, Chairman & CEO: Each year, we influence more than $200 billion of tech spend. This activity informs our advisers and researchers, expands our benchmarking data and delivers data-driven insights and recommendations our clients depend on for their AI-powered business transformations.
p. 2 · Read in context →
Informa / Informa TechTarget (INF)
Through Informa TechTarget (Omdia, Enterprise Strategy Group, Canalys) it sells specialist technology research that names Gartner as a competitor, and through Informa's B2B Live Events it rivals Gartner Conferences.
Informa TechTarget's 10-K names Gartner (with IDC, Forrester and Frost & Sullivan) among the larger, established players in specialist tech research, and states it competes on the specificity of its analysis and analyst coverage.
Providers of specialist tech research include several larger, established players such as Gartner, IDC, Forrester, Frost and Sullivan, and others. We compete against these companies based on the specificity of our analysis, content creation capabilities, and analyst coverage against specific technology categories.
p. 17 · Read in context →
The specialist tech-research brands (Omdia, Canalys, Wards Intelligence, Enterprise Strategy Group) that Informa uses to sell analyst-led research and intelligence to technology vendors — the franchise that overlaps Gartner's syndicated IT research.
Specialist Technology Research: Through the Omdia brand, the specialist brands Canalys and Wards Intelligence and our Enterprise Strategy Group, we provide research and intelligence services to technology providers based on expert analysis and data-driven intelligence and reports.
p. 12 · Read in context →
Informa's stated leadership in B2B Live Events — 800+ specialist brands across 30+ market categories — the events business that competes with Gartner's Conferences segment.
Over the last 10+ years, Informa has built the leading position in B2B Live Events globally, including more than 800 specialist Brands serving 30+ growth market categories in all major geographic regions.
p. 4 · Read in context →
Clarivate (CLVT)
A subscription scientific, academic and IP intelligence franchise; not a product-for-product rival, but it names Gartner in its own capital-markets peer index and runs the same high-retention subscription information-services model.
Clarivate places Gartner in the market-cap-weighted peer index it uses to benchmark shareholder returns — an explicit signal that it regards Gartner as a comparable subscription information-services company.
The following graph compares our total cumulative shareholder return with the Standard & Poor’s Composite Stock Index (“S&P 500”) and a market capitalization-weighted peer index consisting of FactSet Research Systems Inc.; Gartner, Inc.; Moody’s Corporation; MSCI Inc.; S&P Global Inc.; and Verisk Analytics, Inc.
p. 18 · Read in context →
Clarivate's description of its subscription model — 45,000+ customers and renewal rates above 90% delivering predictable revenue — the same recurring, high-retention economics that underpin Gartner's Research segment.
We serve more than 45,000 customers worldwide, including academic institutions and libraries, research organizations, corporations, law firms, government entities, and companies across the pharmaceutical, biotechnology, and medical device industries, providing a trusted foundation and quality user experience resulting in our strong and consistent annual customer renewal rates exceeding 90 percent.
p. 5 · Read in context →
S&P Global (SPGI)
A large subscription data, analytics and research franchise (Market Intelligence) competing for the same enterprise research/insight budgets; its commentary on embedding GenAI to lift subscription retention mirrors Gartner's own AI-versus-subscription question.
S&P Global's stated view that embedding AI tools into its subscription research raises retention — a couple of hundred basis points in Market Intelligence and over 500bps in Energy — the AI-reinforces-subscription flywheel Gartner is also pursuing.
Eric Aboaf, CFO: In the clients that have been using our AI tools and availing themselves of those in Market Intelligence, we're seeing a couple of hundred basis points higher retention rates. In Energy, over 500 basis points of higher retention rates because, again, usage is value for clients.
p. 14 · Read in context →
S&P Global reports more than a third of its Capital IQ Pro users engaging with newly launched AI features — a measure of GenAI adoption inside a subscription-research desktop, the same delivery shift Gartner is making.
Martina Cheung, President & CEO: More than one-third of our CapIQ Pro users engage with the AI features we've launched, including ChatIQ and Document Intelligence.
p. 2 · Read in context →
Thomson Reuters (TRI)
A subscription professional-information and workflow franchise selling recurring content and, increasingly, GenAI (CoCounsel) into enterprises; competes for information/advisory budgets and offers a close structural mirror of Gartner's recurring, high-retention model.
Thomson Reuters' recurring-revenue growth alongside its AI-penetration metric: 9% organic growth and 22% of annualized contract value now from GenAI-enabled products — the same recurring-plus-AI trajectory Gartner is chasing.
Michael Eastwood, CFO: Organic revenue grew 9% in the second quarter, stable with the first quarter and continuing the strong trend from recent periods. […] At the end of Q2, the percent of our annualized contract value, or ACV, from products that are GenAI-enabled was 22%, up from 20% last quarter.
p. 7 · Read in context →
Thomson Reuters' own description of its recurring-subscription, workflow-embedded, high-retention model — the structural analogue to Gartner's subscription research franchise, now layered with embedded AI.
We derive a significant portion of our revenues from selling information and software solutions, mostly on a recurring subscription basis. Our professional-grade solutions are built on comprehensive proprietary content and deep domain expertise with software, embedded AI capabilities and automation tools. We believe our workflow solutions make our customers more productive by streamlining how they operate, enabling them to focus on higher value activities. Many of our customers use our solutions deeply integrated into their workflows, which has led to strong customer retention.
p. 37 · Read in context →
More peer documents
Forrester Q4 FY2025 call — 'three capabilities LLMs cannot deliver' + AI Access — 9 pages · Colony's moat argument (proprietary data, original analysis, access to the analysts who built it), the single Forrester Decisions platform, and >$5m of 2025 AI Access bookings. · Open →
ISG FY2024 10-K — 'what a traditional analyst firm might cover' (p.13) — 125 pages · ISG positions its research as an analyst-firm model plus practitioner feedback — the sharpest direct framing against Gartner's syndicated-analyst approach. · Open →
ISG Q3 FY2025 call — AI-related revenue $20m (4x YoY), 350 clients — 9 pages · Connors quantifies AI advisory/research momentum and brands ISG 'the AI-centered technology research and advisory firm.' · Open →
Informa Q2 FY2024 call — Omdia/Canalys subscription tech-research growth — 29 pages · Management notes the subscription-led specialist tech businesses Omdia and Canalys growing inside a fast-growing Informa Tech division. · Open →
S&P Global Q2 FY2025 call — net renewal rate & subscription-gated AI — 16 pages · Cheung reports the net renewal rate up more than a point YoY and that Kensho/GenAI integrations require the underlying S&P subscriptions — the AI-protects-the-subscription stance. · Open →
Source: S&P Capital IQ consensus via Xpressfeed · Generated 2026-07-19.
Street snapshot
The 13 price targets span $120 to $203, with a mean of $162 and a median of $164 — a wide range in USD for a name where opinion clusters at hold.
Currency: USD · Scale: money in millions, absolute (per share) · Analyst counts shown explicitly; recommendation respondents: 15.
| Street view | Reading | Analysts |
|---|---|---|
| Recommendation mix | Buy 3, Outperform 1, Hold 9, Underperform 1, Sell 1 | 15 |
| Consensus score | 2.73 | 15 |
| Target price | mean 162.5; high 203.0; low 120.0 | 13 |
Forward table
Consensus keeps revenue close to flat — FY2026 of about $6,426m sits just under the FY2025 actual of $6,500m before building toward roughly $7,060m by FY2028 — yet normalized EPS climbs from the $13.17 FY2025 actual toward $17.48 in FY2028, so the Street models earnings growth well ahead of the top line. Gross margin holds near 68–70% and no dividend is modeled (DPS of 0).
Currency: USD · Scale: money in millions, absolute (per share) · Analyst count is the estimate count for each period and metric.
| Period | Metric | Mean | YoY | Analysts | Low / high |
|---|---|---|---|---|---|
| FY0E | Revenue | 6,426 | -1.1% | 14 | 6,385 / 6,474 |
| FY0E | EBITDA | 1,574 | -2.3% | 12 | 1,539 / 1,620 |
| FY0E | EBIT | 1,278 | 7.5% | — | — / — |
| FY0E | Net income (GAAP) | 872.8 | 19.7% | 9 | 862.7 / 890.8 |
| FY0E | Net income (normalized) | 925.1 | -4.5% | — | — / — |
| FY0E | EPS (GAAP) | 12.89 | 33.6% | 9 | 12.49 / 13.28 |
| FY0E | EPS (normalized) | 13.68 | 3.9% | 15 | 13.07 / 14.20 |
| FY0E | Free cash flow | 1,193 | 2.1% | — | — / — |
| FY0E | Dividend per share | 0.00 | — | — | — / — |
| FY0E | Gross margin | 69.7% | 2.0% | — | — / — |
| FY0E | Capital expenditure | -101.3 | -16.5% | — | — / — |
| FY0E | Net debt | 1,170 | -9.5% | — | — / — |
| FY0E | Cash from operations | 1,284 | -1.0% | — | — / — |
| FY0E | ROE | 512.4% | 301.7% | — | — / — |
| FY+1E | Revenue | 6,706 | 4.4% | 14 | 6,544 / 6,884 |
| FY+1E | EBITDA | 1,640 | 4.2% | 12 | 1,530 / 1,698 |
| FY+1E | EBIT | 1,334 | 4.4% | — | — / — |
| FY+1E | Net income (GAAP) | 913.2 | 4.6% | 9 | 859.0 / 943.6 |
| FY+1E | Net income (normalized) | 965.0 | 4.3% | — | — / — |
| FY+1E | EPS (GAAP) | 14.33 | 11.1% | 9 | 13.47 / 15.95 |
| FY+1E | EPS (normalized) | 15.30 | 11.8% | 15 | 13.78 / 17.01 |
| FY+1E | Free cash flow | 1,203 | 0.8% | — | — / — |
| FY+1E | Dividend per share | 0.00 | — | — | — / — |
| FY+1E | Gross margin | 69.6% | -0.1% | — | — / — |
| FY+1E | Capital expenditure | -106.5 | 5.2% | — | — / — |
| FY+1E | Net debt | 622.5 | -46.8% | — | — / — |
| FY+1E | ROE | 462.6% | -9.7% | — | — / — |
| FY+1E | Cash from operations | 1,305 | 1.7% | — | — / — |
| FY+2E | Revenue | 7,060 | 5.3% | 10 | 6,741 / 7,319 |
| FY+2E | EBITDA | 1,737 | 5.9% | 10 | 1,551 / 1,843 |
| FY+2E | EBIT | 1,439 | 7.9% | — | — / — |
| FY+2E | Net income (GAAP) | 980.9 | 7.4% | 6 | 883.0 / 1,030 |
| FY+2E | Net income (normalized) | 1,025 | 6.2% | — | — / — |
| FY+2E | EPS (GAAP) | 16.32 | 14.0% | 6 | 14.77 / 20.27 |
| FY+2E | EPS (normalized) | 17.48 | 14.2% | 10 | 15.68 / 21.43 |
| FY+2E | Free cash flow | 1,406 | 16.9% | — | — / — |
| FY+2E | Dividend per share | 0.00 | — | — | — / — |
| FY+2E | Gross margin | 69.4% | -0.3% | — | — / — |
| FY+2E | Capital expenditure | -114.0 | 7.1% | — | — / — |
| FY+2E | Net debt | 526.2 | -15.5% | — | — / — |
| FY+2E | Cash from operations | 1,375 | 5.3% | — | — / — |
| FY+2E | ROE | 227.1% | -50.9% | — | — / — |
| Q2 FY2026 | Revenue | 1,649 | -2.2% | 13 | 1,614 / 1,675 |
| Q2 FY2026 | EBITDA | 430.1 | -2.9% | 10 | 401.0 / 445.6 |
| Q2 FY2026 | EBIT | 347.7 | 5.0% | — | — / — |
| Q2 FY2026 | Net income (GAAP) | 240.6 | -0.2% | 9 | 222.0 / 254.5 |
| Q2 FY2026 | Net income (normalized) | 252.7 | -0.9% | — | — / — |
| Q2 FY2026 | EPS (GAAP) | 3.53 | 13.5% | 9 | 3.23 / 3.81 |
| Q2 FY2026 | EPS (normalized) | 3.75 | 6.2% | 14 | 3.35 / 3.97 |
| Q2 FY2026 | Free cash flow | 263.9 | -30.4% | — | — / — |
| Q2 FY2026 | Dividend per share | 0.00 | — | — | — / — |
| Q2 FY2026 | Gross margin | 69.7% | 3.0% | — | — / — |
| Q2 FY2026 | Capital expenditure | -24.57 | -19.4% | — | — / — |
| Q2 FY2026 | Net debt | 1,291 | 1210.9% | — | — / — |
| Q2 FY2026 | Cash from operations | 293.2 | -28.3% | — | — / — |
| Q3 FY2026 | Revenue | 1,503 | -1.4% | 13 | 1,486 / 1,528 |
| Q3 FY2026 | EBITDA | 323.6 | -6.7% | 10 | 304.0 / 349.2 |
| Q3 FY2026 | EBIT | 253.3 | 4.2% | — | — / — |
| Q3 FY2026 | Net income (GAAP) | 170.3 | 381.2% | 9 | 149.3 / 194.0 |
| Q3 FY2026 | Net income (normalized) | 185.6 | -0.5% | — | — / — |
| Q3 FY2026 | EPS (GAAP) | 2.54 | 441.3% | 9 | 2.31 / 2.94 |
| Q3 FY2026 | EPS (normalized) | 2.73 | -1.2% | 14 | 2.55 / 3.16 |
| Q3 FY2026 | Free cash flow | 300.5 | -4.3% | — | — / — |
| Q3 FY2026 | Dividend per share | 0.00 | — | — | — / — |
| Q3 FY2026 | Gross margin | 69.7% | 2.9% | — | — / — |
| Q3 FY2026 | Capital expenditure | -23.93 | -20.4% | — | — / — |
| Q3 FY2026 | Net debt | 939.3 | 53.5% | — | — / — |
| Q3 FY2026 | Cash from operations | 337.4 | -1.6% | — | — / — |
| Q3 FY2026 | ROE | 246.3% | 215.8% | — | — / — |
| Q4 FY2026 | Revenue | 1,764 | 0.7% | 13 | 1,742 / 1,784 |
| Q4 FY2026 | EBITDA | 422.3 | -3.1% | 10 | 412.0 / 434.4 |
| Q4 FY2026 | EBIT | 348.3 | 2.6% | — | — / — |
| Q4 FY2026 | Net income (GAAP) | 240.4 | -0.7% | 9 | 225.0 / 250.9 |
| Q4 FY2026 | Net income (normalized) | 257.0 | 0.1% | — | — / — |
| Q4 FY2026 | EPS (GAAP) | 3.66 | 9.1% | 9 | 3.46 / 4.08 |
| Q4 FY2026 | EPS (normalized) | 3.93 | -0.3% | 14 | 3.69 / 4.32 |
| Q4 FY2026 | Free cash flow | 274.4 | -2.5% | — | — / — |
| Q4 FY2026 | Dividend per share | 0.00 | — | — | — / — |
| Q4 FY2026 | Gross margin | 68.1% | 2.1% | — | — / — |
| Q4 FY2026 | Capital expenditure | -25.57 | -14.7% | — | — / — |
| Q4 FY2026 | Net debt | 757.7 | -33.4% | — | — / — |
| Q4 FY2026 | ROE | 357.6% | 137.4% | — | — / — |
| Q4 FY2026 | Cash from operations | 262.8 | -17.1% | — | — / — |
| Q1 FY2027 | Revenue | 1,555 | 2.9% | 11 | 1,505 / 1,594 |
| Q1 FY2027 | EBITDA | 404.4 | 1.1% | 9 | 382.2 / 433.8 |
| Q1 FY2027 | EBIT | 327.0 | 14.2% | — | — / — |
| Q1 FY2027 | Net income (GAAP) | 224.2 | 1.0% | 7 | 201.6 / 243.1 |
| Q1 FY2027 | Net income (normalized) | 235.5 | 15.9% | — | — / — |
| Q1 FY2027 | EPS (GAAP) | 3.46 | 8.9% | 7 | 2.95 / 4.12 |
| Q1 FY2027 | EPS (normalized) | 3.75 | 12.8% | 13 | 3.25 / 4.37 |
| Q1 FY2027 | Free cash flow | 313.8 | 51.9% | — | — / — |
| Q1 FY2027 | Dividend per share | 0.00 | — | — | — / — |
| Q1 FY2027 | Gross margin | 71.1% | 1.5% | — | — / — |
| Q1 FY2027 | Capital expenditure | -24.30 | -1.6% | — | — / — |
| Q1 FY2027 | Net debt | 497.0 | -60.5% | — | — / — |
| Q1 FY2027 | ROE | 353.4% | 201.4% | — | — / — |
| Q1 FY2027 | Cash from operations | 246.2 | 26.3% | — | — / — |
Estimate momentum
Over the past 180 days the Street has cut its out-year revenue line materially — FY2027 from about $7,151m to $6,706m and FY2028 from roughly $7,938m to $7,060m — while normalized EPS held up far better, FY2027 nudging up from $14.88 to $15.30 and FY2028 easing only modestly from $18.72 to $17.48. The revenue markdown runs across both forward years rather than a single period.
Currency: USD · Scale: money in millions, absolute (per share) · Point-in-time consensus; analyst count is shown where supplied.
| Period | Metric | Lookback | Then | Now | Direction / magnitude | Analysts |
|---|---|---|---|---|---|---|
| 2027 | Revenue | 30d | 6,726 | 6,706 | down 0.3% | — |
| 2027 | Revenue | 90d | 6,851 | 6,706 | down 2.1% | — |
| 2027 | Revenue | 180d | 7,151 | 6,706 | down 6.2% | — |
| 2028 | Revenue | 30d | 7,107 | 7,060 | down 0.7% | — |
| 2028 | Revenue | 90d | 7,247 | 7,060 | down 2.6% | — |
| 2028 | Revenue | 180d | 7,938 | 7,060 | down 11.1% | — |
| 2028 | EPS (normalized) | 30d | 17.57 | 17.48 | down 0.5% | — |
| 2028 | EPS (normalized) | 90d | 16.94 | 17.48 | up 3.2% | — |
| 2028 | EPS (normalized) | 180d | 18.72 | 17.48 | down 6.6% | — |
| 2027 | EPS (normalized) | 30d | 15.31 | 15.30 | down 0.0% | — |
| 2027 | EPS (normalized) | 90d | 14.72 | 15.30 | up 3.9% | — |
| 2027 | EPS (normalized) | 180d | 14.88 | 15.30 | up 2.9% | — |
Beat / miss record
The record points to earnings beats struck below the revenue line rather than demand surprises.
Current sequences by metric: Revenue: 1 consecutive miss; EPS (normalized): 8 consecutive beats.
Currency: USD · Scale: money in millions, absolute (per share) · Consensus is captured before each actual first became effective; analyst count shown per observation.
| Quarter | Metric | Consensus as of | Actual | Surprise | Outcome | Analysts |
|---|---|---|---|---|---|---|
| Q1 FY2026 | Revenue | 1,515 | 1,511 | -0.3% | Miss | — |
| Q1 FY2026 | EPS (normalized) | 2.92 | 3.32 | 13.6% | Beat | — |
| Q4 FY2025 | Revenue | 1,749 | 1,753 | 0.2% | Beat | — |
| Q4 FY2025 | EPS (normalized) | 3.51 | 3.94 | 12.2% | Beat | — |
| Q3 FY2025 | Revenue | 1,521 | 1,524 | 0.2% | Beat | — |
| Q3 FY2025 | EPS (normalized) | 2.43 | 2.76 | 13.7% | Beat | — |
| Q2 FY2025 | Revenue | 1,674 | 1,686 | 0.7% | Beat | — |
| Q2 FY2025 | EPS (normalized) | 3.31 | 3.53 | 6.8% | Beat | — |
| Q1 FY2025 | Revenue | 1,535 | 1,534 | -0.0% | Miss | — |
| Q1 FY2025 | EPS (normalized) | 2.72 | 2.98 | 9.7% | Beat | — |
| Q4 FY2024 | Revenue | 1,690 | 1,715 | 1.5% | Beat | — |
| Q4 FY2024 | EPS (normalized) | 3.26 | 5.45 | 67.2% | Beat | — |
| Q3 FY2024 | Revenue | 1,475 | 1,484 | 0.6% | Beat | — |
| Q3 FY2024 | EPS (normalized) | 2.37 | 2.50 | 5.6% | Beat | — |
| Q2 FY2024 | Revenue | 1,585 | 1,595 | 0.7% | Beat | — |
| Q2 FY2024 | EPS (normalized) | 3.03 | 3.22 | 6.4% | Beat | — |
Where the street disagrees
Near-term views are tight by comparison, with FY2026 normalized EPS carrying a standard deviation of only about 0.34.
Currency: USD · Scale: money in millions, absolute (per share) · Dispersion is high-low divided by absolute mean; analyst count shown per item.
| Period | Metric | Mean | Low | High | Spread / mean | Analysts |
|---|---|---|---|---|---|---|
| Q3 FY2024 | Net income (GAAP) | 211.3 | 154.1 | 378.6 | 106.3% | 5 |
| Q3 FY2024 | EPS (GAAP) | 2.72 | 1.99 | 4.86 | 105.4% | 5 |
| 2029 | EPS (normalized) | 21.14 | 16.71 | 25.57 | 41.9% | 2 |
| 2029 | EPS (GAAP) | 19.96 | 15.97 | 23.94 | 40.0% | 2 |
| 2028 | EPS (GAAP) | 16.32 | 14.77 | 20.27 | 33.7% | 6 |
Source: Visible Alpha consensus via S&P Xpressfeed · Consensus as of 2026-07-17 · generated 2026-07-19.
Model trust
This reads as genuine consensus rather than a thin set; one line item is dropped as stale.
Base currency: USD · VA scales normalized from Abs, K, M; item currencies and units retained · Coverage depth and vintage; broker count is the maximum represented.
| Brokers | Line items | Last revision |
|---|---|---|
| 12 | 359 | 2026-07-17 |
Operating KPIs
The most decision-useful drivers are the contract-value book and its net additions, both company-specific.
Base currency: USD · VA scales normalized from Abs, K, M; item currencies and units retained · FY-1A / FY0E / FY+1E; broker count shown per KPI.
| Operating KPI | Source | FY-1A | FY0E | FY+1E | Brokers |
|---|---|---|---|---|---|
| Accounts payable and accrued liabilities | CD | 1,205,525.38bn Amount | 1,169,216.96bn Amount | 1,200,584.85bn Amount | 12 |
| Cash and cash equivalents | CD | 1,593,343.64bn Amount | 1,709,160.60bn Amount | 2,156,719.37bn Amount | 12 |
| Deferred revenues - Current liabilities | CD | 2,756,960.44bn Amount | 2,878,690.15bn Amount | 2,985,082.31bn Amount | 12 |
| Depreciation | CD | 120,127.01bn Amount | 103,780.99bn Amount | 110,692.73bn Amount | 12 |
| Fees receivable | CD | 1,560,543.49bn Amount | 1,604,248.30bn Amount | 1,659,223.94bn Amount | 12 |
| Free cash flow | CD | 1,161,368.54bn Amount | 1,161,577.73bn Amount | 1,226,601.02bn Amount | 12 |
| Goodwill | CD | 2,813,537.55bn Amount | 2,735,368.50bn Amount | 2,728,852.83bn Amount | 12 |
| Property, equipment and leasehold improvements, net | CD | 229,641.96bn Amount | 197,879.78bn Amount | 181,623.57bn Amount | 12 |
| Total assets | CD | 7,787,805.36bn Amount | 7,776,050.81bn Amount | 8,218,995.49bn Amount | 12 |
| Total current assets | CD | 3,698,974.53bn Amount | 3,902,446.94bn Amount | 4,426,519.19bn Amount | 12 |
| Total current liabilities | CD | 3,962,945.82bn Amount | 4,053,365.69bn Amount | 4,190,709.08bn Amount | 12 |
| Total liabilities and stockholders' equity | CD | 7,854,383.87bn Amount | 7,816,184.81bn Amount | 8,184,254.52bn Amount | 12 |
P&L bridge
Base currency: USD · VA scales normalized from Abs, K, M; item currencies and units retained · Margins are derived against revenue; YoY compares adjacent fiscal columns; broker count shown per line.
| P&L line | FY-1A | FY0E | FY+1E | Brokers |
|---|---|---|---|---|
| Revenue | 6,494,228.47bn Amount | 6,420,915.44bn Amount (-1.1% YoY) | 6,722,219.95bn Amount (4.7% YoY) | 11 |
| Gross Profit | 4,405,479.78bn Amount (67.8% margin) | 4,478,628.28bn Amount (69.8% margin; 1.7% YoY) | 4,695,283.20bn Amount (69.8% margin; 4.8% YoY) | 11 |
| Ebitda | 1,588,438.26bn Amount (24.5% margin) | 1,575,570.19bn Amount (24.5% margin; -0.8% YoY) | 1,649,211.53bn Amount (24.5% margin; 4.7% YoY) | 12 |
| Operating Income | 1,031,028.78bn Amount (15.9% margin) | 1,222,926.20bn Amount (19.0% margin; 18.6% YoY) | 1,285,804.79bn Amount (19.1% margin; 5.1% YoY) | 10 |
| Net Income | 970,161.29bn Amount (14.9% margin) | 925,064.88bn Amount (14.4% margin; -4.6% YoY) | 971,724.55bn Amount (14.5% margin; 5.0% YoY) | 12 |
| Eps | 12.79 Amount | 13.66 Amount (6.8% YoY) | 15.35 Amount (12.3% YoY) | 12 |
Consensus dispersion
Base currency: USD · VA scales normalized from Abs, K, M; item currencies and units retained · Top high-low spreads relative to absolute mean; requires at least 3 brokers.
| Line item | Period | Mean | Min | Q1 | Q3 | Max | Spread / mean | Brokers |
|---|---|---|---|---|---|---|---|---|
| Free cash flow | 1QFY-2026 | 198,734.27bn Amount | -13,758.24bn Amount | 140,556.19bn Amount | 262,541.26bn Amount | 333,001.24bn Amount | 174.5% | 10 |
| Cash and cash equivalents | FY-2025 | 1,593,343.64bn Amount | 1,141,326.05bn Amount | 1,214,865.75bn Amount | 1,602,764.02bn Amount | 3,416,779.44bn Amount | 142.8% | 11 |
| Free cash flow | 1QFY-2027 | 335,080.51bn Amount | 135,604.99bn Amount | 246,809.80bn Amount | 422,220.24bn Amount | 593,199.07bn Amount | 136.6% | 10 |
| Free cash flow | 2QFY-2027 | 310,136.90bn Amount | 74,811.67bn Amount | 235,412.15bn Amount | 402,165.15bn Amount | 487,907.31bn Amount | 133.2% | 10 |
| Cash and cash equivalents | FY-2027 | 2,156,719.37bn Amount | 925,215.22bn Amount | 1,719,458.68bn Amount | 2,722,615.21bn Amount | 3,745,256.13bn Amount | 130.8% | 12 |
| Free cash flow | 2QFY-2026 | 257,839.03bn Amount | 128,714.45bn Amount | 182,731.23bn Amount | 335,838.21bn Amount | 418,105.72bn Amount | 112.2% | 10 |
Quarterly path
Base currency: USD · VA scales normalized from Abs, K, M; item currencies and units retained · Next four supplied quarters; final column is maximum broker coverage in the row.
| Quarter | Accounts payable and accrued liabilities | Cash and cash equivalents | Deferred revenues - Current liabilities | Depreciation | Fees receivable | Total revenue | EPS Diluted, Applicable to common stockholders($) | Broker coverage |
|---|---|---|---|---|---|---|---|---|
| 3QFY-2026 | 982,682.40bn Amount | 1,717,923.78bn Amount | 2,709,471.92bn Amount | 25,580.07bn Amount | 1,266,690.84bn Amount | 1,503,946.74bn Amount | 2.71 Amount | 12 |
| 4QFY-2026 | 1,155,416.57bn Amount | 1,735,247.93bn Amount | 2,886,069.88bn Amount | 26,742.25bn Amount | 1,611,868.52bn Amount | 1,765,024.50bn Amount | 3.92 Amount | 12 |
| 1QFY-2027 | 864,223.80bn Amount | 1,859,111.34bn Amount | 3,067,604.41bn Amount | 26,339.24bn Amount | 1,465,400.22bn Amount | 1,554,702.64bn Amount | 3.69 Amount | 12 |
| 2QFY-2027 | 933,295.92bn Amount | 2,013,634.63bn Amount | 2,879,300.53bn Amount | 27,234.74bn Amount | 1,370,082.16bn Amount | 1,724,246.92bn Amount | 4.19 Amount | 12 |
61 stale period values omitted; 1 line item fully removed.
Source: S&P Capital IQ transcripts via Xpressfeed · latest indexed call 2026-05-05 · generated 2026-07-19.
Latest call digest
Gartner, Inc., Q1 2026 Earnings Call, May 05, 2026 · 2026-05-05T12:00:00
Q1 FY2026 call — May 5, 2026. Management opened on a beat: first-quarter insights revenue, EBITDA, adjusted EPS ($3.32) and free cash flow all ran ahead of plan, and Gartner raised its full-year EBITDA, adjusted-EPS and free-cash-flow guidance while repurchasing $535 million of stock. Contract value grew 1% year-over-year (3.5% excluding the U.S. federal government), which the CFO framed as an acceleration off the fourth quarter.
The prepared-remarks story was continuity and confidence: the four-dimension business-and-technology-insights (BTI) transformation, AI as the highest-demand client topic, and a reiterated commitment to compound adjusted EPS above 12% over the next three years off a 2025 base. The Q&A reality was more guarded. Gene Hall disclosed that new business was strong in January and February but that client decisions slowed in March on geopolitics, with purchase decisions escalated to the CFO or CEO and longer cycles; he said many March-deferred deals closed in April. Analysts pressed hardest on when CV actually reaccelerates — magnitude, exit rate and per-segment cadence — and management declined to quantify beyond accelerating over the course of the year, notably no longer repeating the high-single-digit 2026 figure it gave in mid-2025. On pricing, management was firm: no discounting and no change to the November price increase, rebutting intra-quarter chatter about below-$50k new-license deals. The ~250bp U.S. federal drag is expected to begin lapping in Q2.
Participant coverage from the latest call.
| Group | Participants | Count |
|---|---|---|
| Management | David Cohen — Senior Vice President of Investor Relations, Gartner, Inc.; Eugene Hall — CEO & Chairman, Gartner, Inc.; Craig Safian — Executive VP & CFO, Gartner, Inc.; Operator | 4 |
| Analysts | Jeffrey Meuler — Senior Research Analyst, Robert W. Baird & Co. Incorporated, Research Division; Faiza Alwy — Research Analyst, Deutsche Bank AG, Research Division; Andrew Nicholas — Analyst, William Blair & Company L.L.C., Research Division; Jason Haas — Executive Director & Senior Equity Analyst, Wells Fargo Securities, LLC, Research Division; Surinder Thind — Equity Analyst, Jefferies LLC, Research Division; Joshua Chan — Analyst, UBS Investment Bank, Research Division; Toni Kaplan — Senior Analyst, Morgan Stanley, Research Division; Keen Fai Tong — Research Analyst, Goldman Sachs Group, Inc., Research Division; Jeffrey Silber — MD & Senior Equity Analyst, BMO Capital Markets Equity Research; Jasper Bibb — VP of Equity Research, Truist Securities, Inc., Research Division; Scott Wurtzel — Research Analyst, Wolfe Research, LLC; Ashish Sabadra — Analyst, RBC Capital Markets, Research Division; Wahid Amin — Research Analyst, BofA Securities, Research Division | 13 |
Curated latest-call exchanges; one row per analyst topic.
| Analyst | Firm | Topic | What changed in Q&A |
|---|---|---|---|
| Jeffrey Meuler | Robert W. Baird | March slowdown and April recovery | Asked whether March-deferred deals are converting in April; Hall said many delayed deals closed in April and new-business softness was broad-based across new logo and existing clients. |
| Faiza Alwy | Deutsche Bank | Geopolitics and pricing | Pressed on the regional spread of the slowdown (worse in GCC/airlines/transport) and whether pricing is being reworked; management said pricing is appropriate and tiered, and that lost deals are about broad cost-cutting, not price. |
| Andrew Nicholas | William Blair | U.S. federal headwind | Asked when the ~250bp federal drag eases; Safian said Q2 begins lapping the DOJ-driven declines that started in March 2025, with ~$114M of federal CV remaining. |
| Keen Fai (George) Tong | Goldman Sachs | Sub-double-digit CV and exit rate | Pushed for a decomposition of below-historical CV growth and the year-exit rate; Safian named federal as the dominant ~250bp headwind but declined to guide CV, reaffirming only acceleration over 2026. |
| Toni Kaplan | Morgan Stanley | LLM distribution and consulting | Asked whether Gartner would distribute proprietary data through LLM providers and if labor-based consulting weakness is structural; Hall said that is not the value proposition and sees no structural AI damage, only macro deferral. |
| Jasper Bibb | Truist Securities | Discounting speculation | Asked about rumored below-$50k ASP new-license deals; Safian said Gartner does not offer discounts and there is no change to pricing mechanics or the November 1 increase. |
Theme tracker
Themes are curator-classified across supplied calls.
| Theme | Status | Quarters mentioned | Read-through |
|---|---|---|---|
| AI as the highest-demand client topic | persisted | Q2 2024, Q1 2025, Q2 2025, Q3 2025, Q4 2025, Q1 2026 | Evolved from one disruption among many into the single largest demand area across every role, plus an internal productivity lever and the AskGartner product rolled out through 2025. |
| AI as a substitution/disintermediation risk | persisted | Q2 2025, Q3 2025, Q4 2025, Q1 2026 | A recurring analyst worry (LLMs, deep-research tools, data distribution). Management consistently reports, from its per-deal loss tracking, that AI-as-substitute is immaterial to churn. |
| U.S. federal government / DOGE headwind | persisted | Q1 2025, Q2 2025, Q3 2025, Q4 2025, Q1 2026 | Emerged in Q1 2025 and has been the dominant CV drag every quarter since (~250bp in Q1 2026); nearly all one-year federal contracts repriced in 2025, and management expects the base to stabilize and lap from Q2 2026. |
| Tariff-affected industries and cost-cutting escalation | persisted | Q1 2025, Q2 2025, Q3 2025, Q4 2025, Q1 2026 | ~35-40% of CV sits in tariff-exposed industries; recurring symptoms are longer sales cycles and purchase decisions escalated to the CFO/CEO. Management frames it as cyclical macro behavior, not lost demand. |
| CV deceleration and the reacceleration promise | persisted | Q1 2025, Q2 2025, Q3 2025, Q4 2025, Q1 2026 | Contract value slid from 7% (Q1 2025) to 1% (Q4 2025 and Q1 2026). Management has promised reacceleration on every call, while the double-digit target has been pushed out to 2027 and beyond. |
| Business & Technology Insights (BTI) transformation | emerged | Q4 2025, Q1 2026 | Given comprehensive framing at Q4 2025 across four dimensions — impact, volume, timeliness, user experience — and pitched as a multi-year step-change in client engagement and retention; described as the most change in company history. |
| Share repurchases and capital return | persisted | Q1 2025, Q2 2025, Q3 2025, Q4 2025, Q1 2026 | ~$2 billion repurchased in 2025 (share count down roughly 8-10% year-over-year), funded partly by an inaugural investment-grade bond; a central pillar of the EPS-growth algorithm. |
| Digital Markets / non-subscription business | dropped | Q3 2025, Q4 2025, Q1 2026 | A recurring soft spot reclassified into Other at Q3 2025, sold under a definitive agreement announced at Q4 2025, and excluded from all Q1 2026 figures — pruned to refocus on the core Insights business. |
Guidance ledger
Quotes, calls, and speakers are source-verified; outcomes are curator-classified.
| Verbatim guidance | Call | Speaker | Curator outcome | Outcome note |
|---|---|---|---|---|
| “For Q4, we expect adjusted EBITDA of at least $400 million.” | Gartner, Inc., Q3 2025 Earnings Call, Nov 04, 2025 · 2025-11-04T13:00:00 | Craig Safian | kept | Q4 2025 adjusted EBITDA came in at $436 million, above the floor. |
| “For Q1, we expect adjusted EBITDA of $370 million or more.” | Gartner, Inc., Q4 2025 Earnings Call, Feb 03, 2026 · 2026-02-03T13:00:00 | Craig Safian | kept | Q1 2026 adjusted EBITDA was $395 million, above the guide. |
| “We expect 2026 adjusted EPS of $12.30 or more.” | Gartner, Inc., Q4 2025 Earnings Call, Feb 03, 2026 · 2026-02-03T13:00:00 | Craig Safian | pending | Raised to at or above $13.25 at Q1 2026 on higher EBITDA and a lower share count; full-year result not yet known. |
| “We expect 2026 adjusted EPS at or above $13.25, an increase from last quarter” | Gartner, Inc., Q1 2026 Earnings Call, May 05, 2026 · 2026-05-05T12:00:00 | Craig Safian | pending | Full-year 2026 figure with only Q1 reported (adjusted EPS $3.32 in the quarter). |
| “All these factors would get us to at least high single-digit growth in 2026, well on our way back to double-digit growth in 2027 and beyond.” | Gartner, Inc., Q2 2025 Earnings Call, Aug 05, 2025 · 2025-08-05T12:00:00 | Craig Safian | pending | 2026 CV grew 1% year-over-year in Q1 (3.5% excluding U.S. federal), below a high-single-digit pace; by Q1 2026 management no longer repeats the high-single-digit figure. Full year not complete. |
| “we would exit this year with CV growth in the low to mid-single digits.” | Gartner, Inc., Q2 2025 Earnings Call, Aug 05, 2025 · 2025-08-05T12:00:00 | Craig Safian | missed | Total CV exited 2025 up 1% in Q4, below the low-to-mid-single-digit range; excluding U.S. federal it was about 4%, within range. |
| “we expect to deliver adjusted EPS on a compound annual basis above 12% over the next 3 years.” | Gartner, Inc., Q1 2026 Earnings Call, May 05, 2026 · 2026-05-05T12:00:00 | Eugene Hall | pending | Three-year compound commitment off a 2025 base year; too early to assess. |
Q&A pressure map
Question counts and firms are curator tallies; analyst coverage shown above.
| Topic | Questions | Firms | Pressure / response |
|---|---|---|---|
| CV reacceleration trajectory and drivers | 6 | Robert W. Baird, Wells Fargo, Jefferies, Goldman Sachs, Truist Securities | The dominant line of questioning. Analysts pushed for the magnitude, exit rate and per-segment cadence of the promised 2026 acceleration; management declined to quantify, repeating that CV accelerates over the course of the year and citing its policy of not guiding CV. |
| March / geopolitical selling slowdown | 3 | Robert W. Baird, Deutsche Bank, UBS | Probing the depth, regional spread and durability of the March air-pocket and whether March-deferred deals recovered in April. |
| Sales headcount and BD-vs-AE mix | 3 | William Blair, RBC Capital Markets, BMO Capital Markets | Cadence of quota-bearing headcount growth (low-single GTS, mid-single GBS) and the deliberate tilt toward hiring business developers over account executives. |
| Pricing and discounting | 2 | Deutsche Bank, Truist Securities | Pricing power and rumored below-$50k ASP new-license discounts; management denied any change to discounting or pricing mechanics. |
| U.S. federal headwind lapping | 2 | William Blair, Goldman Sachs | Timing of the ~250bp federal drag easing; management points to Q2 2026 as the lapping point with the base assumed flat for the year. |
Language shifts
Only language evidence verified against the referenced component is shown.
| Observation | Verbatim evidence | Call ID | Component |
|---|---|---|---|
| First explicit call-out of a mid-quarter demand air-pocket: management said January-February new business was strong but that decisions slowed in March on geopolitics — a specific caution not present in prior calls. | “Due to changes in the geopolitical environment, client decisions slowed somewhat in March.” | 1996258445 | 1 |
| In mid-2025 management attached a specific number to the 2026 reacceleration, framing CV as reaching at least high-single-digit growth. | “All these factors would get us to at least high single-digit growth in 2026, well on our way back to double-digit growth in 2027 and beyond.” | 1954175581 | 2 |
| By Q1 2026 the same reacceleration is asserted without a figure; the high-single-digit framing has dropped out of both prepared remarks and Q&A. | “we expect contract value will accelerate.” | 1996258445 | 1 |
| Escalating, defensive framing around the overhaul — management stresses this is the most change in company history, signaling how much is riding on the transformation. | “we made more change in the last year than we've ever made in the history of Gartner in terms of increasing value to clients.” | 1996258445 | 37 |
The through-line of the last five quarters is a steady contract-value deceleration (7% to 1%) set against a reacceleration management keeps promising and keeps deferring — now framed for 2026 without the specific high-single-digit number it used in 2025. Profitability, buybacks and guidance beats have been dependable; the question the call history sharpens is whether the BTI transformation converts into a CV inflection before the 2027 double-digit target arrives.
The Derating
Gartner is a subscription research and advisory business that grew revenue from $4.1 billion in 2020 to $6.5 billion in 2025, and the stock still lost roughly three-quarters of its value — from an intraday peak of $551.80 in November 2024 to $140.19 in July 2026 [1]. This chapter establishes what the company is, how it earns, why the market repriced it, and the question the rest of this report exists to answer.
What Gartner is
Gartner sells research and advice by subscription. It serves more than 13,000 enterprises across roughly 90 countries, and reports in three segments: Business and Technology Insights (renamed from "Research" in 2025), Conferences, and Consulting [2]. The core is Insights: recurring subscriptions that give executives access to Gartner's analysts, proprietary research, and decision tools. That segment produced $5.07 billion of 2025 revenue at a 77% gross contribution margin — the economic engine of the company [3]. Conferences ($645 million) and Consulting ($552 million) round out the model but are secondary [4].
FY2025 Revenue ($M)
Insights Contract Value ($M)
Enterprise Clients (approx.)
Operating Cash Flow ($M)
Sources: FY2025 Annual Report (Form 10-K), Executive Summary [5] and Reportable Segments [6].
Source: FY2025 Annual Report (Form 10-K), Executive Summary and Reportable Segments [7].
The model has genuinely attractive properties. Subscriptions are prepaid and renew on a rolling basis; the marginal cost of serving one more seat with existing research is low, which is why Insights carries a mid-70s gross contribution margin. For most of the last decade this compounded: revenue rose every year from 2016 to 2025, and the share count fell as the company returned cash. That is the picture — a wide-margin, cash-generative franchise — against which the market repriced the stock.
What the market did
The share price rose roughly seven-fold from its 2018 year-end ($128) to its 2024 peak, then gave nearly all of the late-cycle gain back. From the November 2024 high of $551.80, the stock fell to $140 by mid-2026 — a decline of about 75% — with the sharpest legs down after the mid-2025 and early-2026 results [8].
Source: exchange price history (quarter-end closing prices), as reported.
At $140, the market values Gartner's equity at about $10.6 billion — roughly 15 times the $9.65 of GAAP earnings the company reported for 2025 [9]. A business that grew revenue every year now trades at a multiple that prices in little further earnings growth. The reason the market gives is visible in the operating data.
The crack in the franchise
Contract value — the annualized run-rate of subscriptions in force — is the leading indicator for a business that recognizes revenue over the life of a subscription. It stalled in 2025. Global Technology Sales (GTS) contract value, the larger of the two sales engines, was flat at $3.91 billion, and total Insights contract value grew just 1% [10]. More telling, wallet retention — how much existing clients spend on renewal versus a year earlier — fell below 100% for the first time in years: GTS dropped to 96% from 102%, and Global Business Sales (GBS) to 99% from 106% [11]. A figure below 100% means the installed base is contracting in dollars, not expanding.
Sources: FY2025 Annual Report (Form 10-K), Reportable Segments [12]; FY2023 figures from prior-year 10-K, as reported.
Management attributes the slippage to two forces it names directly. The first is the US public sector, especially the federal government, where contract value fell by double digits and dragged on the whole book [13]. The second is broader: "decreased spending from existing clients" — enterprises trimming discretionary research budgets [14]. Layered on top is an investor debate the filings do not settle: whether large-language-model tools erode the value of paying for human research and advice. Public-sector cyclicality and a structural question about the product are difficult to separate in a single year of data — and the market, so far, has priced them together.
The earnings line looks worse than the operating reality, which is worth separating out. GAAP net income fell from $1.25 billion to $0.73 billion and diluted EPS from $16.00 to $9.65, but two items distort the comparison: a $150 million goodwill impairment on the Digital Markets unit in 2025 (sold in February 2026 for about $110 million), and a large event-cancellation insurance gain that had lifted 2024 [15]. Operating income fell 11% to $1.03 billion, and roughly $150 million of that decline was the non-cash impairment [16]. The real deterioration is not yet in reported profit; it is in the run-rate.
Source: derived from reported financials, FY2020–FY2025 10-Ks; 2025 figures per FY2025 Annual Report, Results of Operations [17].
What is still intact
Whatever the market fears, it is not solvency. Gartner generated $1.29 billion of operating cash flow in 2025, held $1.7 billion of cash, and had about $1.0 billion of undrawn revolver capacity [18]. Against roughly $2.98 billion of long-term debt, that leaves net debt near $1.26 billion — under one year of operating cash flow [19]. The subscription model collects cash in advance, so working capital funds itself. Bankruptcy risk, for this business at this leverage, is remote.
The company has also spent heavily on its own stock. In 2025 it repurchased 7.0 million shares for about $2.0 billion — reducing the diluted share count that has fallen from about 92 million in 2018 toward 76 million today [20]. That buyback was executed at an average price near $286 — well above where the shares now trade, a fact the capital-allocation chapter will need to weigh. The machine that shrinks the share count is intact; whether it was pointed at the right price is a separate question.
Solvency is not the debate. A business generating $1.3 billion of operating cash flow against roughly $1.26 billion of net debt is not a bankruptcy candidate. The debate is whether the subscription franchise is stalling cyclically or structurally.
The question this report answers
Gartner arrives as a fallen star: a high-margin, cash-generative franchise that the market once priced for durable double-digit growth and now prices for stagnation, after contract value flatlined and wallet retention slipped below 100% for the first time in years. The central question this report exists to answer is whether that roughly 75% derating correctly prices a permanent, AI- and budget-driven impairment of the research-subscription franchise, or overshoots a still-cash-generative, lightly levered business suffering a mostly cyclical stall in its growth engine.
Everything that follows tests one side of that question or the other: how the subscription economics actually behave, how much of the slowdown is the US public sector versus the whole book, whether the AI threat shows up in the numbers, what management has done with capital, who owns the stock and how they are paid, and what price today implies. The evidence is genuinely two-sided, and the chapters ahead are built to weigh it rather than to settle it by assertion.
Financials and Estimates
Gartner earns more cash than its reported profit suggests. Across FY2023–FY2025 revenue grew from $5.91B to $6.50B while GAAP earnings swung on one-off items, but operating cash flow stayed near $1.3B and free cash flow near $1.2B. The balance sheet is lightly levered — net debt under one year of cash flow — so despite thin book equity the risk of insolvency is remote. Consensus sees roughly flat revenue in 2026, then modest growth; at about ten times forward earnings, a lot of pessimism is already in the price.
Revenue: growth narrowed, and the mix is being cleaned up
The reported top line grew 6.1% in FY2024 and 3.7% in FY2025 [1]. That deceleration reads worse than the underlying business behaved. Insights — the subscription research franchise that is the core of the case — grew 5.0% to $5.07B, and Conferences grew 10.5% to $0.64B. The drag came from "Other," which is the Digital Markets unit: it fell to $0.23B from $0.37B two years earlier and was sold in February 2026 [2]. Stripping it out, the recurring engine held mid-single-digit growth even through the contract-value stall covered in The Derating.
Source: FY2025 Annual Report (Form 10-K), Consolidated Statements of Operations [3].
Earnings Quality
GAAP diluted EPS fell from $16.00 in FY2024 to $9.65 in FY2025, but neither number is a clean run-rate [4]. FY2024 carried a $300.0M gain on event-cancellation insurance and an unusually low tax charge; FY2025 absorbed a $150.0M non-cash goodwill write-down on the Digital Markets unit that was then sold — the bridge is laid out in The Derating [5]. Management's own adjusted EPS, which strips those items, was $13.17 for FY2025 [6]. EBITDA margin, the metric management guides to, held at 24.8% in both years — so the profit decline is a matter of below-the-line items and one write-down, not an operating-margin collapse [7].
Source: FY2025 Annual Report (Form 10-K), Consolidated Statements of Operations [8].
Cash comfortably beats earnings
The subscription model is paid in advance, so cash arrives before the revenue is recognized. That is why operating cash flow has run above net income every year: $1.16B, $1.48B and $1.29B across FY2023–FY2025, against net income of $0.88B, $1.25B and $0.73B [9]. In FY2025, cash conversion was 1.8 times net income; with capital spending light, free cash flow was about $1.2B [10]. The 10-K attributes this to "the favorable working capital dynamics of our subscription-based business model," where the majority of Insights contracts are paid in advance [11].
Source: FY2025 Annual Report (Form 10-K), Consolidated Statements of Cash Flows [12].
There is one tell that the stall is real, not just narrative. Gartner's FY2025 stall shows up in two independent places: US federal Insights contract value fell from about $270 million to about $126 million, a roughly $144 million drag that held total contract-value growth to 1%, while the change in deferred revenue flipped from a $181 million source of cash to a $42 million use.[13][14][15]. Prepaid subscriptions sit on the balance sheet as deferred revenue, and billings decelerated faster than recognized revenue — the same slowdown, showing up in cash a step ahead of the income statement. The deferred-revenue balance itself still stood at $2.81B, a large interest-free float the business collects up front [16].
Balance sheet: lightly levered, and the thin equity is a buyback artifact
For a reader who wants bankruptcy risk close to zero, the leverage picture is reassuring on the metrics that matter and misleading on the ones that don't. At December 31, 2025 Gartner held $1.72B of cash against $2.98B of total debt — five tranches of senior notes maturing 2028 through 2035, issued for the first time as an investment-grade credit — leaving net debt of about $1.26B [17] [18] [19]. That is under one year of operating cash flow, and roughly 1.9 times EBITDA gross. Operating income covered interest expense of $125.3M more than eight times over [20]. There is a further $1.0B of undrawn revolver capacity [21].
Cash
Net Debt
Net Debt / Op Cash Flow
Interest Cover (x)
Source: FY2025 Annual Report (Form 10-K), Consolidated Balance Sheets and Statements of Operations [22]; interest coverage derived from reported operating income and interest expense [23].
Book equity looks alarming in isolation — just $0.32B, down from $1.36B a year earlier — and goodwill alone is $2.74B, so tangible equity is deeply negative [24]. That is not distress; it is the arithmetic of buybacks. Gartner has repurchased so much stock — $2.0B in FY2025 alone — that accumulated treasury stock has all but erased the equity line, even as accumulated earnings kept climbing [25]. The relevant point for solvency is that debt is serviced from cash flow, not book value, and the cash flow is ample. The caveat: debt rose about $0.5B in FY2025 specifically to fund those repurchases, so leverage is drifting up rather than down — a use of cash worth its own scrutiny, which a later chapter takes on.
Forward estimates: flat, then a modest reacceleration
Management's 2026 guidance is deliberately conservative — it assumes buybacks only large enough to offset dilution and no interest income on cash that will likely be deployed, so the reported floor understates the probable outcome [26]. On that basis the company guides to adjusted EBITDA of at least $1.515B, free cash flow of at least $1.135B, GAAP diluted EPS of at least $11.38 and adjusted EPS of at least $12.30, on roughly 71M shares [27]. Sell-side consensus sits above the floor: adjusted EPS of about $13.68 in FY2026 and $15.30 in FY2027, on revenue of roughly $6.43B then $6.71B. The near-flat 2026 revenue line largely reflects the Digital Markets divestiture rather than a shrinking core.
Sources: FY2025 adjusted EPS per Q4 FY2025 earnings call [28]; FY2026–FY2027 figures are consensus analyst estimates, as reported.
Source: consensus analyst estimates, as reported.
What the price implies
At $140, against roughly 71M shares, Gartner is a business of about $10B of equity value and $11B of enterprise value carrying a still-recurring, 68%-gross-margin franchise that converts more than its net income to cash. On consensus adjusted EPS that is about 10 times FY2026 and 9 times FY2027 earnings; the enterprise trades near 7 times FY2025 EBITDA, and free cash flow alone is a yield of roughly 11% on the equity [29] [30]. At about ten times forward earnings and seven times EBITDA, the price embeds no growth in the earnings base — the multiple of a flat-to-declining annuity, not a compounding one.
Forward P/E (FY2026E)
EV / EBITDA (FY2025)
FCF Yield (guide)
Source: derived from the $140 share price and reported/guided figures — FY2025 EBITDA and free cash flow [31], FY2026 guidance [32], and consensus estimates.
The analyst community is not enthusiastic, which is itself informative for a fallen-star setup: of fifteen ratings, four are positive, nine neutral, and two negative, with a mean price target of $162 against the current $140 — implying about 16% upside to the average view, a $120 low target roughly 14% below the price, and a $203 high near 45% above it. The skew is toward "wait and see," and the $120 low target sits only about 14% below the current price — a discount consistent with stagnation, not a deep collapse. The financials establish the two facts that bound the cyclical-versus-structural question — the cash is real and the balance sheet is safe, so a buyer is paying for the durability of the subscription base, not betting on survival.
Source: consensus recommendations and price targets, as reported.
Contract Value Stall
Gartner's FY2025 stall shows up in two independent places: US federal Insights contract value fell from about $270 million to about $126 million, a roughly $144 million drag that held total contract-value growth to 1%, while the change in deferred revenue flipped from a $181 million source of cash to a $42 million use [1][2][3][4]. The two run on different plumbing — one is a booked-order figure, the other a cash-flow line — and they point the same way. The question this chapter works is whether the stall is the cyclical, federally-driven dip management describes, or the first visible edge of a structural decline.
The federal cliff inside the flat number
The aggregate hides a wide split. FY2025 Insights contract value was flat at plus 1% — but that nets a still-growing commercial book against a collapse in the US federal book. Gartner entered 2025 with roughly $270 million of federal contract value, about 5% of the total, most of it in GTS on one-year contracts [5]. It exited 2025 with about $126 million, having retained "less than half" of the prior-year federal book, plus $3 million of termination-for-convenience notices [6].
Source: derived from reported figures — total Insights CV change of $41M (p.51) and US federal CV of ~$126M vs ~$270M (p.39, Q4 2024 call) [7][8].
The arithmetic sets the stakes. A roughly $144 million federal drop against a total change of positive $41 million — the federal drag is about 3.5 times the net change — implies the commercial book grew about $185 million, or near 4% [9]. Management's own segment commentary matches: commercial enterprise sizes grew mid-single-digit for GTS while "public sector contract value decreased by double digits," primarily US federal [10]. Because federal is now down to about $126 million and its contracts are annual, most of the damage is already in the base — the year-over-year drag largely anniversaries out in 2026, and if it does, the headline reaccelerates mechanically toward the commercial book's mid-single-digit rate.
The cash statement confirms the same stall from an independent direction. The change in deferred revenue — the billings cushion that funds future recognized revenue — swung from a $181 million source of cash in 2024 to a $42 million use in 2025, a roughly $223 million reversal [11]. Deferred revenue moves with billings, and billings lead recognized revenue, so a source-to-use swing of that size is the cash-side signature of decelerating new and renewal business a beat before it reaches the P&L.
Two caveats keep this from being a clean all-clear. First, near-4% commercial growth is itself a step down from the double-digit rates of 2021–2022, so the softness is not purely federal. Second, the recovery is so far asserted, not visible: in the quarter ended March 2026 — with the federal book largely already in the base — total Insights contract value was still up only 1%, and GTS contract value "increased slightly," short of the mid-single-digit rate the commercial-reacceleration case needs [12]. Wallet retention kept thinning as well — GTS to 97% and GBS to 98%, both still falling year-over-year even as client retention held at 85% and 86% [13]. The federal story is largely told; the commercial-renewal story is not.
The metric that leads revenue
Gartner sells annual research subscriptions and recognizes the revenue ratably over the contract. Contract value — the annualized dollar value of every subscription in force at a point in time — therefore leads reported revenue by about a year. Management describes it as measuring "revenue that is highly likely to recur over a multi-year period" [14], and the filings bear the mechanism out: FY2025 Insights revenue rose 5% "primarily due to Insights contract value growth in 2024" [15]. Flat contract value entering 2026 is, mechanically, roughly flat Insights revenue for 2026 — the stall is already booked a year out regardless of what happens next.
Two retention rates govern where contract value goes. Client retention counts the enterprises kept year-over-year; wallet retention measures the dollars kept, so a wallet rate above client retention signals retained clients spending more, and a rate below 100% means the surviving base is shrinking in dollars [16]. The distinction between the two is where the cyclical and structural readings part.
FY2025 Insights CV growth (FX-neutral)
GTS wallet retention (FY2025)
US federal Insights CV, Dec-2025 ($M)
Sources: FY2025 Annual Report (Form 10-K), Reportable Segments — p.51 [17]; Recent Developments — p.39 [18].
A four-year glide, not a one-year stumble
The deceleration is not new to 2025. Foreign-currency-neutral contract-value growth in the two sales engines — Global Technology Sales (GTS), the larger book selling to IT leaders, and Global Business Sales (GBS), selling to every other function — has stepped down every year since the post-pandemic peak.
Sources: FY2021 10-K p.50 [19]; FY2022 10-K p.47 [20]; FY2023 10-K p.47 [21]; FY2024 10-K p.46 [22]; FY2025 10-K p.51 [23].
GTS contract value grew 14%, 10%, 6%, 7%, then decreased slightly; GBS grew 24%, 19%, 13%, 12%, then 3% [24][25]. The 2021 peak was a rebound off a soft 2020, so part of this line is normalization. But GTS — three-quarters of the Insights book at $3.91 billion — has now spent four straight years slowing, and reached flat in 2025 [26]. A reader looking only at the FY2025 print sees an air pocket; the multi-year series shows a franchise whose organic momentum has been fading for longer than the derating suggests. That is the fact the bull case has to sit with.
The logos stayed; the wallets thinned
What separates a budget stall from displacement is whether customers leave or merely spend less. Through the whole window, Gartner's client-retention rate held in a tight band — GTS between 83% and 86%, and it actually ticked up to 85% in FY2025 [27]. Wallet retention is what broke: GTS fell from a 106% peak in 2021 to 96% in 2025, GBS from 115% to 99% [28][29]. Both dropped below 100% for the first time in the series — management attributes it to "lower levels of spending by existing clients" [30].
Sources: FY2021 10-K p.50 [31]; FY2023 10-K p.47 [32]; FY2025 10-K p.51 [33].
Read literally, clients aren't abandoning the product — they are buying fewer seats and modules within it. That is more consistent with a budget cycle than with substitution, because a displaced product tends to lose logos, not just dollars.
The counter-fact is in the same filings. The count of enterprises Gartner serves has drifted down even as the retention percentage held — from "more than 15,000" in FY2021 to "over 13,000" in FY2025 [34][35]. A stable ~85% retention rate against a shrinking base means new-logo wins have not fully replaced the ~15% that churn each year in count terms. Some of that is deliberate up-market mix — wallet retention historically exceeded client retention, meaning Gartner keeps its higher-spending accounts — but a roughly 13% decline in enterprises served over four years is not nothing, and it is the strongest evidence on the structural side of the ledger.
Whether AI is in the numbers yet
The structural fear is that generative AI erodes demand for packaged human research. The corpus supports a narrower reading: AI is, for now, Gartner's single largest demand driver, not a visible substitute. Management calls AI "our highest demand topic," and reports more than 6,000 AI-related documents, 1,000-plus catalogued use cases, and over 200,000 AI client conversations in 2025 [36]. Asked directly in early 2024 why that interest had not lifted seat demand, CEO Gene Hall was candid: AI "is a key topic that often helps us secure sales," but "it's not that demand suddenly appeared; rather, AI is replacing prior interests" [37].
That is the honest state of the evidence: AI sustains Gartner's relevance and helps close new business, but it has not yet converted into wallet expansion, and the company's own 10-K concedes that disruptive technologies "in areas of artificial intelligence and machine learning … could affect the nature of how we generate revenue" [38]. What the numbers do not show is displacement: if AI were substituting for the product, the damage would appear first in client retention and logo count, and client retention held or rose across every year of the AI build-out.
The balance of evidence
On the weight of the evidence, the FY2025 stall reads as more cyclical than structural: the year-over-year swing is dominated by a quantifiable, largely one-time federal cliff, the customer logos stayed, and AI is a demand tailwind rather than a visible substitute. The read is not clean — a four-year growth glide, wallet retention below 100% and still falling into 2026, and a base of served enterprises down about 13% since 2021 all cut the other way, and none of them is explained by federal alone.
Of the moving parts, the case is most sensitive to wallet retention. If it climbs back through 100% as the federal drag anniversaries out during 2026, the stall was a budget cycle and the derating overshot the operating reality. If it stays below 100% into 2027 with federal already in the base, the erosion is coming from the commercial core — and a low-teens multiple on a slowly shrinking annuity is not the bargain it looks like. The first-quarter 2026 print, GTS wallet retention at 97% and still declining, says the question is open [39]. The financial safety established in the Financials and Estimates chapter is what buys the time to watch it resolve.
Competitive Moat
Gartner's advantages are real and show up in the numbers: a 77% contribution margin on its Insights subscriptions, ~3–4% price increases taken every year for more than fifteen, and retention that beats its only pure-play peer on every measure while the business runs roughly eighteen times that peer's size. But the moat has clear limits — it rests on annual contracts, roughly one-in-seven logo churn, "limited barriers to entry" by the company's own account, and a sharpened, self-disclosed risk that large language models erode the value of the content.
What the moat is made of
The franchise is built on scale and reuse. Gartner is in steady contact with over 13,000 client enterprises, fields more than 2,400 business and technology experts, and logged more than 510,000 direct client interactions in 2025; 77% of Insights contracts are multi-year [1]. The company describes its differentiators as the breadth and quality of its research, a brand carried under the Gartner name for more than 40 years, a global footprint across roughly 90 countries, and the operating leverage of distributing one body of intellectual property across subscriptions, conferences, and consulting [2].
That reuse is what a moat looks like in the margin line. The Insights segment converts 77% of its revenue into gross contribution — the same rate in 2025 and 2024 — because the marginal cost of serving one more subscriber the existing research library is close to zero [3]. Conferences (50%) and Consulting (34%) are respectable businesses, but the economic moat lives almost entirely in the subscription.
Source: FY2025 Annual Report (Form 10-K), segment results [4].
Insights Contribution Margin
Insights Contract Value ($M)
Peer Community Members
Typical Annual Price Increase
Sources: FY2025 10-K, Item 1 Business and segment results [5] [6]; Q3 FY2024 earnings call [7]; Q1 FY2026 earnings call [8].
The switching cost is behavioral, not contractual. A licensed user builds Gartner into how decisions get made — the Magic Quadrants, the analyst inquiries, the benchmarking, and the 100,000-plus executive peer community [9]. Management's clearest evidence for stickiness is engagement-linked: clients who used AskGartner, its new AI search layer, renewed at "substantially higher" rates than those who did not, even at the same engagement levels [10]. But the contracts are annual, and client retention of about 85% means roughly one in seven logos turns over each year [11]. The moat has to be re-earned every twelve months.
Pricing power, and its ceiling
Gartner has raised prices every year, on a set schedule, for a long time. The CFO put the mechanism plainly: most price adjustments take effect on November 1, the 2025 increase was "just under 4" percent, and the company has "typically raised prices between 3% and 4% for over 15 years" — with the stated purpose of offsetting wage inflation [12]. That is durable pricing power, and few subscription businesses can point to a fifteen-year record of it.
It is also its ceiling. Inflation-matching price increases are a defensive tool, not a growth engine, and they frame what the retention data means. When GTS wallet retention fell to 96% and GBS to 99% in 2025 — the first sub-100% readings in years — it happened despite a ~4% list-price increase, which means the underlying seat and module base contracted by close to a tenth on a like-for-like basis [13]. Pricing held; volume did not. The moat protected the dollar-per-seat, not the number of seats — a distinction the Contract Value Stall traced through the federal cliff and the commercial book.
The competitive set is thin, and Gartner is winning it
The peer screen surfaces six names — Forrester, Information Services Group, Informa (which owns Omdia), S&P Global (451 Research), Clarivate, and Thomson Reuters. Only one, Forrester, runs the same model: syndicated technology-and-business research, analyst advisory, Magic-Quadrant-style vendor evaluations, and an events business [14]. The others are conglomerates in which research is a sliver, competing at the edges rather than head-to-head.
Against that one true comparable, Gartner is not losing share — it is pulling away. Forrester's research contract value fell 6% to $292.4 million in 2025 [15], its client base shrank 7% to 1,797 [16], and it posted a net loss of roughly 30% of revenue after a goodwill impairment [17]. Gartner's Insights contract value, roughly eighteen times larger at $5,155 million, still grew 1% [18]. On both retention measures Gartner sits well ahead.
Sources: Gartner FY2025 10-K, Insights segment [19]; Forrester FY2025 10-K, contract value [20] and key metrics [21].
The read that follows is important: the softness in the numbers is not a rival taking Gartner's customers. Forrester is stalling harder, and the same pattern shows in its metrics — logos holding while wallets thin (its client retention actually rose to 77% as wallet retention fell to 87%) [22]. The pressure on the category is coming from somewhere other than competitors. Gartner's own filing names the direction it expects it to come from: "We anticipate encountering more competition with increased adoption of AI services," alongside the candid admission that "limited barriers to entry exist in the markets in which we do business" [23].
The AI question cuts both ways
For now, AI is a demand driver. It is Gartner's single highest-demand topic; in 2025 the company held more than 200,000 in-depth client conversations on AI, answered more than 500,000 AI questions through AskGartner, and built a library of over 6,000 AI documents [24]. The pitch is that Gartner sits between the buyers and sellers of AI and offers independent guidance neither side can — "No one else does what we do at our scope and scale" [25]. On the current evidence, more AI in the world means more questions Gartner gets paid to answer.
The same technology is also the clearest structural threat the company discloses, and the FY2025 language is sharper than prior years. The 10-K now warns that disruptive technologies including AI "could affect the nature of how we generate revenue," that LLMs surfacing substantive content "could reduce the need to enter our websites," and — most directly — that "although generally contractually prohibited, clients or others may load our proprietary information into large language models, which could reduce the value of our offerings" [26]. Gartner's response is to build with the technology rather than around it: AskGartner launched in August 2025, now updates every two weeks, and answers in 25 languages [27].
Management is watching the substitution question closely enough to instrument it. The CEO described asking every salesperson to log any instance of a client mentioning "using AI as a substitute," routed through a help desk so the company can track whether clients are "considering AI instead of Gartner" [28]. That a company builds a monitoring pipeline for a threat is not proof the threat is materializing — but it is a fair measure of how seriously the risk is taken internally. So far the displacement does not show in the hard data: client retention held or rose, and the retention pattern is category-wide rather than Gartner-specific.
The Durability Read
The moat is narrow but durable. Scale, brand, embedded workflow, and a fifteen-year pricing record give Gartner defensible economics and a widening lead over its only pure-play peer — but annual contracts, one-in-seven logo churn, self-described low entry barriers, and a sharpened AI-substitution risk keep it from being a wide moat.
Two things would move the read toward wide. If wallet retention re-crosses 100% as the federal drag anniversaries out, and if the AskGartner engagement-to-renewal link holds up across a full renewal cycle, the case is that AI deepens the moat by making the library more usable and more essential. Two things would move it toward eroding: client retention breaking below its long 83–86% band, or new-business generation drying up — either would signal the product is being displaced rather than merely trimmed. Neither has happened yet. Whether the commercial book compounds after the cycle turns remains a live question the retention data raises but cannot yet settle — and it feeds directly into whether the ~75% derating priced a cyclical stall or a structural fade.
Gartner sells into a market it sizes near $200 billion against roughly $4 billion of its own contract value — a penetration low enough that the demand ceiling is not the binding constraint. The engine is rising enterprise-technology complexity, which kept growing through the current stall. The live question is AI: today it is expanding the range of topics Gartner is paid to advise on, while the company's own filings now name it as a force that could erode the value of the offering.
A market management sizes near $200 billion
Asked in early 2022 to put a number on the opportunity, Gartner's then-CFO gave one: roughly a $55 billion market in the segments where its Global Technology Sales force sells, of which Gartner held $3.2–3.3 billion, and close to a $145 billion market on the Global Business Sales side, of which it held under $1 billion [1]. GTS sells to users and providers of technology; GBS sells to every other enterprise function — HR, finance, supply chain, marketing [2]. On those figures the combined market is about $200 billion and Gartner sits on roughly 2% of it.
Two cautions belong on that number before it is used. It is management's own estimate — unaudited, several years old, and produced by a vendor with an interest in a large addressable market, and it is directional rather than precise. And it is a self-serving framing in a second sense: management describes these as "large — very large untapped market opportunities … it's not like we have to steal share of wallet from someone else" [3]. Even discounting the sizing heavily, the conclusion survives: penetration is in the low single digits, and it is lowest exactly where Gartner has been trying to grow — the non-IT functions of GBS, where it held under 1% of its own stated market.
Source: management's addressable-market estimate and Gartner's then-current contract value, Q4 2021 earnings call [4]; penetration derived. Figures are management estimates, unaudited.
The demand engine is enterprise-technology complexity
What drives that market is not a line item Gartner controls; it is the rate at which enterprise technology gets more complicated. Business leaders, the FY2025 10-K argues, "cannot be operationally effective unless they incorporate the right strategy, management and technology decisions into every part of their business," across digital transformation, cybersecurity, supply-chain disruption and regulatory change [5]. Each new disruptive priority is another topic executives will pay to be advised on, and Gartner's long-term strategy is explicitly to deepen penetration of existing accounts rather than depend on winning wholly new ones [6].
Gartner does not merely ride enterprise technology spending — it forecasts it, and those forecasts feed its own sales planning. On the Q4 2022 call, management framed the vendor channel off a house forecast that technology companies selling into enterprise IT would grow about 7.8% globally in 2023, "because enterprise IT spending … tend[s] to be multi-year contracts and annual increases" [7]. The relevant feature for Gartner is that its own fee is small relative to what its clients spend: management notes "the incremental difference in Gartner fees is typically a small fraction of their budgets," so price is rarely the reason a client declines — "it's the broader budget decisions" [8]. That is the tailwind stated precisely: a subscription priced as a rounding error against the technology budgets it helps direct, sold into a market management still calls "large" as recently as Q1 2026 [9].
A growing market, a decelerating share-taker
The distinction that matters for the through-line is between the market shrinking and Gartner's demand slowing within a market that is still growing. The evidence points to the second. Enterprise technology spending kept rising through 2025; what compressed was client budgets under macro and tariff pressure, plus a one-time US federal cliff — a demand-timing problem, not a contracting addressable market. The Contract Value Stall isolates that mechanism: Insights contract value grew just 1% in FY2025 [10], even as the market underneath it did not shrink.
A healthy market is necessary but not sufficient. A large, growing TAM alongside 1% contract-value growth cuts two ways: it supports the cyclical read (the runway is intact, so demand can reaccelerate), but it also means a low-single-digit-penetration company failed to convert an expanding market into growth in 2025, and its commercial book decelerated to roughly 4%. The tailwind only helps if Gartner turns it back into contract value; the market's size does not do that on its own. Whether that reconversion happens, not the size of the market, is what separates the cyclical read from the structural one.
AI: a two-sided force
AI is where the industry story stops being one-directional. On the demand side, it is currently the strongest tailwind in the set: management calls harnessing AI "one urgent priority for the majority of our clients," positions Gartner as "one of the world's leading experts in AI" advising both end-users and technology vendors, and publishes a steady stream of AI market forecasts that keep it at the center of the conversation [11]. More AI adoption means more decisions to advise on, which is why the Competitive Moat chapter found no displacement yet in retention or logos.
The same technology also carries a disclosed downside — the FY2025 10-K now names AI as a force that could erode demand rather than expand it — but that competitive-threat case, along with management's field read that no such substitution is yet visible, belongs to the Competitive Moat chapter.
Source: client AI priority and Gartner's advisory positioning, Q1 2025 call [12]. Demand-side compression is analytical framing, not a company estimate.
The measured read is that AI is a net topic-expander today and a disclosed, not-yet-realized threat tomorrow. The tailwind is real — a large, growing, lightly-penetrated market whose complexity keeps generating new priorities — but it is not self-executing, and AI could turn it negative. The signals that would relocate the erosion from the budget cycle into the market itself, chiefly client retention and new-business generation, are tracked in What's Priced In. Until then, the industry backdrop supports the cyclical interpretation without settling it.
Buybacks and Alignment
Gartner is run by professional managers, not owners: the CEO holds 1.8% of the stock and all directors and officers 2.6%, while index funds dominate the register. Pay is heavily equity and tied to contract value, and the CEO's 2025 options are struck far above today's price — so management shares the drawdown. Capital returns run entirely through buybacks, about $6.0 billion since 2021, bought counter-cyclically but with a large slug now underwater.
Who owns Gartner
For an investor who prizes owner-operators, the ownership answer is plain: Gartner is not one. Eugene Hall, CEO since 2004 and now also Chairman, beneficially owns 1,219,897 shares — 1.8% of the company — and all 24 directors and executive officers as a group own 1,760,321 shares, or 2.6% [1]. The register is controlled by passive and quasi-passive institutions: Vanguard 14.2%, BlackRock 10.8%, Baron Capital 6.4% and Capital International 6.1% [2].
CEO ownership
All insiders (24)
Top 4 institutions
Source: 2026 Proxy Statement (DEF 14A), beneficial ownership table [3].
That fails the founder-and-skin-in-the-game test outright. The qualifier is scale, not proportion: at about $140 a share Hall's 1.8% is still roughly $170 million of stock, and the collapse from the $551.80 peak covered in The Derating cost him something on the order of $500 million on paper. His wealth moves with the shares even though his slice of the company is small.
How management is paid
Hall's reported 2025 compensation was $19.2 million, up from $18.4 million in 2024 and $16.3 million in 2023 — pay rose through the contract-value stall and the derating [4]. The ratio of CEO pay to the median employee ($127,275) was 151-to-1 [5]. Those are large-cap norms, not outliers.
Source: 2026 Proxy Statement (DEF 14A), Summary Compensation Table [6]; equity share is stock plus option awards over total, derived.
What matters more than the headline is the structure, which is unusually aligned. Long-term incentives are 88% of the CEO's target pay, and 100% of that is performance-based — stock-settled appreciation rights (SARs) plus performance stock units (PSUs) [7]. The SARs only pay on appreciation above the grant price: Hall's 2025 grant of 29,105 SARs carries a strike of $534.45, set on 6 February 2025 near the top [8]. At $140 that entire tranche — reported as $5.0 million of "option awards" — is worth nothing. Reported and realizable pay diverge here: a meaningful share of what management was "paid" in 2025 exists only if the stock recovers.
The PSUs are tied to contract value, the metric the case is most sensitive to. In 2025 they were earned at 82.1% of target — a below-target outcome that reflected the stall — and the CEO must hold Gartner stock worth at least six times his base salary, a guideline all named officers met [9]. The short-term cash bonus tells the other side of the story: it paid at 119.6% of target, because its metrics were EBITDA (149.3% of goal) and revenue (89.8%), both of which held up while contract value did not [10]. So the equity plan flexed down with the leading indicator while cash rewarded the resilient P&L.
One design choice cuts against management: the US federal public sector was excluded from the 2025 contract-value plan targets and actual results, on the grounds of its uncertainty [11]. That is the very ~$144 million federal cliff analysed in Contract Value Stall. Carving it out is defensible — the cuts were policy-driven and outside management's control — but it also insulated incentive pay from the single largest drag on the reported numbers.
The buyback engine
Gartner pays no dividend. Every dollar it returns to shareholders goes through repurchases, so buyback discipline is most of what there is to judge on capital return. The program has been running hard: about $6.0 billion of stock retired across 2021–2025, against a board authorization of $1.2 billion (2015) plus $6.3 billion of incremental approvals through January 2026 [14].
Sources: FY2021–FY2025 Forms 10-K, MD&A repurchase disclosures [12] [13] [14] [15] [16].
The per-year record, with implied average prices:
Sources: FY2021–FY2025 Forms 10-K [17] [18]; average price derived from cash and shares. The company rounds annual cash to $0.1 billion, so the middle-year averages are approximate.
The cumulative effect on the share count is real and permanent. Shares outstanding fell from about 88.8 million at the end of 2020 to 70.8 million at the end of 2025, and to 67.5 million by April 2026 — roughly a 24% reduction [19] [14] [20]. Fewer shares is how a flat-to-modestly-growing cash flow still compounds per share.
Timing, and the mark to market
The skeptic's first charge is that Gartner bought back stock at the top. The record only partly supports it. On a mark-to-market basis the recent program is underwater: the roughly 21.5 million shares retired for $6.0 billion in 2021–2025, at a blended ~$280, are worth about $3.0 billion at $140. That is a paper loss of roughly $3 billion against the cash deployed, and the worst-priced vintages were 2023 and 2024, when Gartner paid an implied $330–$440 for small quantities.
But the tranches that moved real money were bought into the decline, not at the peak. The cleanest evidence is the first-quarter comparison across the derating. In Q1 2025, with the stock near its high, Gartner repurchased just 300,745 shares at an average of $507.65 — $163 million. In Q1 2026, with the stock near $155, it repurchased 3,310,253 shares at an average of $158.49 — $535 million, more than three times the dollars at less than a third of the price [21]. Within that quarter it paid $155.53 in February and $163.25 in March [22]. And the board leaned further in as the price fell, adding $600 million of authorization on 30 April 2026, leaving about $640 million available under a cumulative $7.5 billion program [23].
Source: Q1 FY2026 Form 10-Q, share repurchase activity [24].
The one genuine caution is funding. Gartner states that repurchases are funded "by cash on hand and borrowings," and in November 2025 it issued $800 million of senior notes whose net proceeds could be applied, among other things, to buying back stock [25]. Borrowing to buy shares that then fell magnifies any misjudgment on price — though, as Financials and Estimates sets out, net debt remains under one year of operating cash flow, so the leverage taken on for buybacks is modest rather than aggressive.
The read: management is a disciplined, well-aligned professional steward rather than an owner-operator. The equity-heavy, contract-value-linked pay plan and the underwater 2025 options keep management exposed to the same downside as shareholders, and the buyback — judged on the tranches that mattered — was executed counter-cyclically, heavier and cheaper as the stock fell. The counter-fact a bull must hold: there is no dividend, so all of the return of capital runs through buybacks; a slug of the 2021–2025 repurchases is underwater, and part is debt-funded. What would change the read in either direction is straightforward to watch: continued heavy repurchase near today's ~11% free-cash-flow yield would confirm the price discipline, while a pull-back in buybacks or fresh borrowing to sustain them at higher prices would undercut it.
Management Credibility
On the day the securities class period opens management said contract value would exit 2025 above 7.8% on the way to 12-16%, and instead Insights contract-value growth decelerated every quarter to 0.8% with the technology-sales channel at zero. [1] [2] [3].
Management guided contract value to accelerate off a 7.8% base toward the 12–16% medium-term model and instead delivered a monotonic decline to 0.8%, with the technology-sales channel — the larger of the two books — running to roughly zero: a roughly seven-point miss over five quarters. It then reprinted the identical 12–16% model for 2026, so the base case that the derating overshoots — a re-acceleration in contract-value growth — is the same forecast that just failed, and deserves a discount rather than the benefit of the doubt. Several facts cut the other way in the same breath: Gartner does not issue formal contract-value guidance, it disclosed the roughly $270M of federal contract value at risk on that same February 2025 call, and it hit the formal revenue and EPS guidance it did give. A securities class action now covers that exact window.
The projection at the start of the class period
The class period the plaintiffs' bar has drawn — February 4, 2025 through February 2, 2026 — is not arbitrary [4]. It opens on the morning Gartner reported 2024 results and set its 2025 outlook, and closes the day before the print that reset it.
That morning management guided to at least $6,555M of revenue and at least $11.45 in adjusted EPS, and — critically for a subscription business whose revenue trails its order book by about a year — described a bookings trajectory that would build through the year [5]. The framing was specific. The CFO introduced the numbers as ones "we view as achievable with opportunity for upside" [6], told analysts "our guidance reflects CV continuing to accelerate during 2025" [7], and, asked directly whether the 7.8% fourth-quarter exit rate was a floor, answered that the company "would expect to be higher than 7.8%" leaving 2025, "with a goal towards continuing to accelerate to first double digit and then to our medium-term objective of 12% to 16%" [8]. The same deck reprinted the medium-term model — Research 12–16%, total revenue at least 10% — under the header "Medium Term Guidance (unchanged)" [9].
The federal exposure that later drove much of the miss was disclosed the same morning: roughly $270M of contract value, about 5% of the total, with the caveat that "potential government changes may affect our business in the short term" [10]. So the risk was named. What is at issue is the direction management projected around it.
What the leading indicator did
Contract value is the order book that becomes next year's subscription revenue, and it did the opposite of accelerate. Total Insights contract-value growth decelerated in a straight line from 7.9% in the fourth quarter of 2024 to 0.8% a year later. The technology-sales channel, the larger of the two, ran to zero.
Source: Q4 2025 Earnings Supplement, GTS / GBS / total Insights contract-value metrics at 2026 FX rates [11]. The 10% line is the low end of the "at least 10%" medium-term revenue target management reaffirmed [12].
Wallet retention tells the same story from the renewal side: technology-sales wallet retention fell through 100% and kept going, from 102.1% at the end of 2024 to 96.0% a year later [13]. This is the mechanism behind the deceleration — existing clients renewing for less — and it is covered in more depth in the Contract Value Stall. What matters here is the gap between the projected path and the realized one: management guided acceleration off a 7.8% base and delivered eight consecutive quarters of the reverse.
The guidance that held, and the guidance that broke
The revenue and earnings guardrails largely held, which is the strongest fact against reading this as a broken business. Across four quarterly updates management trimmed the top line for weaker bookings but nudged adjusted EPS higher, and the year finished at $6,497M of revenue and $13.17 of adjusted EPS — the revenue about 1% below February's opening "at least $6,555M," the EPS well above the $11.45 it started with, carried by buybacks and tax [14].
Sources: 2025 earnings supplements — Feb 4 [15], May 6 [16], Aug 5 [17], Nov 4 [18]; FY2025 actuals [19].
What broke was the forward outlook. On February 3, 2026 — the corrective moment that closes the class period — management guided 2026 to at least $6,455M of revenue, roughly flat, and to adjusted EPS of at least $12.30, below the $13.17 just delivered [20]. A subscription compounder guiding earnings down is the market's confirmation that the stall had reached reported results, not just the order book; the stock fell about 21% that day. The distinction that matters for credibility is that Gartner mostly hit the numbers it formally guided while the growth story it narrated around them proved wrong.
The same projection, a second time
The 2026 guidance did not retire the re-acceleration thesis — it repeated it. The February 2026 deck again reprinted the 12–16% Research / at-least-10% revenue model under "Medium Term Guidance (unchanged)," and framed the 2026 revenue guide on contract value accelerating over the course of the year [21]. Management's explanation for 2025 was external: "a unique year due to a range of external market forces" — DOGE-related federal cuts, evolving trade policy, state and local funding changes, and a weak tail of non-AI technology vendors [22].
The first datapoint on the second projection is not yet cooperating. First-quarter 2026 total Insights contract-value growth came in at 1.0%, with the technology-sales channel at 0.4% and business sales at 3.2% — a tentative flattening, not the acceleration the guide embeds [23]. The base case now leans on the identical forecast that missed by a wide margin the year before, which is the specific reason management's forward word carries less weight than a clean track record would grant it.
Insights CV growth, 4Q25
2025 adj. EPS delivered ($)
2026 adj. EPS guide (≥, $)
Sources: Q4 2025 Earnings Supplement, Insights metrics [24] and 2026 guidance [25]; FY2025 adjusted EPS [26].
The lawsuit, weighed
The class action codifies the credibility gap rather than proving fraud. Filed in the spring of 2026, it covers buyers between February 4, 2025 and February 2, 2026 and alleges that Gartner "lacked a reasonable basis for accelerating contract-value and consulting projections" as DOGE and tariff headwinds built — with the lead-plaintiff process run by the usual event-driven firms and a deadline in mid-May 2026 [27].
Several facts cut the other way, and a fair reading holds them together rather than choosing sides:
Management named the federal risk on the opening call, formally hit its 2025 revenue and EPS guidance, and does not issue contract-value guidance — the acceleration language was framed as expectation, and the DOGE-driven federal cliff was a genuine external shock disclosed as a risk, not a hidden one.
Post-drop securities suits are close to automatic after a fall of this size, and the pleading bar under the PSLRA — actual knowledge or recklessness, not hindsight error — is high. The company's own decks carry pages of forward-looking-statement cautions, including the explicit risk of failing to "achieve continued customer renewals and achieve new contract value" [28]. None of that makes the suit meritorious, and none of it makes the projections right; it means the litigation is best treated as a symptom of the credibility problem, not independent evidence of it. The evidence that actually matters is on the metrics page, not the docket.
On balance, management's financial discipline is intact — it guided a hard year roughly correctly and kept the P&L where it said it would be — but its forward growth narrative was materially wrong for a full year and has been restated for 2026 largely unchanged, so the base-case re-acceleration deserves a discount, not the benefit of the doubt. What would change that read is straightforward and near: contract-value growth actually inflecting up through 2026's middle quarters, above the 1.0% first-quarter mark and toward the double-digit path management again projects. If it does, the 2025 miss looks like the cyclical shock management describes; if it flattens or rolls over again, the second projection fails the same way the first did, and the credibility discount widens.
Peer Multiples
Gartner trades at roughly 9–10x forward earnings and about 8x EV/EBITDA — the multiple of a shrinking, loss-making research pure-play, not of the premium subscription-information franchises it operationally resembles. S&P Global and Thomson Reuters, growing faster and earning higher margins, still command about 22x. The category has not re-rated; Gartner specifically has. Whether that discount is earned is the question this chapter takes up.
Where Gartner sits in its category
Gartner belongs to a small set of subscription-and-data businesses that sell recurring research, benchmarks, and workflow content to enterprises. Two of them — S&P Global and Thomson Reuters — are the category's quality leaders. Two others — Forrester Research and Clarivate — show what the same model looks like when growth turns negative. Gartner's operations belong with the first pair; its valuation sits with the second.
Gartner forward P/E
S&P Global / Thomson Reuters
Forrester forward P/E
Gartner 9.4x, the premium pair ~22x, Forrester ~13x on depressed earnings. These are approximate market figures (share prices and consensus estimates) as of mid-July 2026, not recomputable from the filings; Gartner's own ~8x EV/EBITDA and ~9.4x forward P/E per the same feed.
The fundamentals behind those multiples make the gap concrete. S&P Global earned $15.3 billion of revenue in 2025, up 8%, at a 42% operating margin [1]. Thomson Reuters grew revenue 3% as reported and 7% organically [2]. Gartner grew 3.7% to $6.5 billion [3]. Forrester's revenue fell 8%, with events down 29% [4], and Clarivate's fell 4% [5].
Fundamentals (revenue growth, operating margin) from FY2025 Form 10-K filings: Gartner [6], S&P Global [7], Forrester [8], Clarivate [9]. Market caps and multiples are approximate market figures (prices and consensus estimates), mid-July 2026, not recomputable from the corpus; S&P Global EV/EBITDA derived. Clarivate's forward P/E and EV/EBITDA are not meaningful on a net loss.
Two tiers are visible. The premium pair trades at about 22x forward earnings; Gartner and the distressed pure-plays trade in the single digits to low teens. The difference between the tiers is not franchise quality; it tracks the growth rate, which runs from +8% at S&P Global down to −8% at Forrester.
Whether the discount is earned
Part of it plainly is. S&P Global grew 8% and accelerated; its operating margin is 42%, more than double Gartner's 16% GAAP figure [10]. Thomson Reuters is compounding revenue at 7% organically [11]. A business whose contract value has decelerated to roughly 1% (Contract Value Stall) should trade below businesses still growing mid-to-high single digits. Some of Gartner's discount is the market correctly pricing a slower grower.
Two adjustments narrow the margin gap without closing the growth gap. Gartner's blended GAAP operating margin looks low because conferences and consulting dilute it and because stock compensation runs through it; on the cleaner run-rate the business earns a ~25% adjusted EBITDA margin, and its Insights research segment carries a 77% contribution margin (Competitive Moat). And S&P Global's reported operating profit is struck after $1.1 billion of annual intangible amortization from the IHS Markit merger [12], which flatters Gartner's relative cash economics. EV/EBITDA, which normalizes both capital structure and amortization, still leaves Gartner at roughly 8x on trailing FY2025 EBITDA — about 7x on the 2026E guided EBITDA the valuation chapters use — against roughly 14x for Thomson Reuters and near 19x for S&P Global.
What the discount does not price is any resemblance to the premium tier's durability. Gartner grew revenue, generated more than $1.1 billion of free cash flow, and held wallet retention at 96–99% and client retention near 85% in a down year (Contract Value Stall). At 8x EBITDA the market is valuing that franchise closer to a business in decline than to the compounders it out-retains. The Thomson Reuters comparison is the most direct: the two grew reported revenue at a nearly identical 3% in 2025 [13] [14], yet Gartner's EV/EBITDA is roughly 57% of Thomson Reuters'. The market is paying up for Thomson Reuters' faster organic line and paying down Gartner's stall; the direction is defensible but the magnitude is wide.
Revenue growth from FY2025 10-K filings (cited above); EV/EBITDA from market data, mid-July 2026 (S&P Global derived). Clarivate omitted — EV/EBITDA not meaningful.
What Forrester says about the downside
Forrester is the closest downside comparison: the one indexed peer that runs Gartner's exact model — subscription research plus consulting and events — and whose contract value actually turned down. Revenue fell 8% in 2025, research declined 6%, consulting 13%, and events 29% [15]. It took two goodwill impairment charges — $83 million and $26 million — in the year [16]. Its market capitalization has collapsed to roughly $200 million, about 0.2x revenue and 4x EBITDA.
Forrester also exposes a trap in reading the P/E column. On depressed earnings Forrester trades near 13x forward — optically richer than Gartner's 9–10x — even as it trades at a fifth of a year's revenue. Where a research business is heading shows up in EV/sales and EV/EBITDA long before it shows up in P/E. On those asset-based lenses Forrester (0.2x sales, 4x EBITDA) is priced as a franchise in decline; Gartner (roughly 1.6x sales, 8x EBITDA) is priced halfway between Forrester and the premium pair — cheaper than its retention and cash generation suggest, dearer than a genuinely shrinking peer.
The relative-value read
Gartner's multiple has two natural anchors, and which one applies is the cyclical-versus-structural question in valuation form. If the contract-value stall is cyclical — the federal cliff anniversaries out and wallet retention re-crosses 100% — the relevant comparison is S&P Global and Thomson Reuters at ~22x, and the re-rating room from 9–10x is large. If the stall is structural — retention keeps sliding toward Forrester's experience — the relevant comparison is Forrester, today's multiple is roughly fair, and Forrester's 0.2x sales shows there is still room to fall. The market has priced Gartner in the distressed tier while its operations remain in the premium one; the same contract-value inflection the report flags elsewhere (What's Priced In) is what would move it from one anchor to the other.
What's Priced In
At $140.19, Gartner trades at about 10 times forward earnings, 7 times EBITDA and a ~12% free-cash-flow yield — below where it stood at the end of 2020, and roughly a quarter of the multiple it carried at its 2024 peak. Adjusted earnings barely moved over that span, so the derating is almost entirely a change in the multiple, not the earnings. This chapter quantifies what that price now assumes and frames the outcomes around it.
The derating was a re-rating
The share price fell about 75% from its November-2024 peak, but adjusted earnings did not. Adjusted EPS — which already strips out the 2025 goodwill impairment and the 2024 event-cancellation insurance gain — was $14.09 in 2024 and $13.17 in 2025, a 6.5% decline [1]. Consensus puts 2026 back at $13.68 (as reported). Against a 75% price decline, the earnings line is close to flat. The move down was a de-rating.
Trailing P/E uses each date's price over the most recent full-year adjusted EPS ($14.09 for FY2024, $13.17 for FY2025). Source: adjusted EPS from the 4Q25 earnings presentation [2]; prices as reported.
The peak multiple of roughly 39 times was a growth-stock rating applied to a business compounding contract value at low double digits. The current 10-to-11 times is the rating the market reserves for a business it expects to stop growing. What changed between the two was not the cash the company produces — free cash flow was $1.18 billion in 2025 [3] — but the growth investors will pay for. That distinction sits underneath every scenario below.
What the price implies
The arithmetic of the current price sets the frame. Gartner had 66,951,889 shares outstanding as of May 1, 2026 [4], so at $140.19 the equity is worth about $9.4 billion. Net of $1.7 billion of cash against roughly $3.0 billion of fixed-rate senior notes [5], enterprise value is about $10.7 billion. Against company guidance of at least $1,515 million of adjusted EBITDA and at least $1,135 million of free cash flow for 2026 [6], that is about 7 times EBITDA and a free-cash-flow yield near 12%.
Forward P/E (2026E)
EV / EBITDA (2026E)
FCF yield (2026E)
Forward P/E on consensus 2026 adjusted EPS of $13.68 (as reported); EV/EBITDA and FCF yield on 2026 company guidance [7]; share count per the Q1 2026 10-Q [8].
A 12% free-cash-flow yield is the return an owner earns if free cash flow simply holds flat forever. Turned into a discount-rate frame, the current price implies falling rather than flat cash flow. Capitalizing the $1,135 million guided free cash flow as a perpetuity at $10.7 billion of enterprise value solves for a required-return-minus-growth spread of about 10.6%. At an 8% discount rate that implies free cash flow shrinking about 2.6% a year in perpetuity; at 10%, about 0.6% a year.
Derived: implied growth g = discount rate − (2026E free cash flow of $1,135M ÷ enterprise value of ~$10.7B). Free cash flow from 2026 guidance [9]; enterprise value from the Q1 2026 balance sheet [10].
The relevant comparison is history: operating cash flow compounded at about 7% a year over the past five years, and revenue at roughly 6% over three. The price is discounting a permanent break from that record — a business that shrinks slowly and indefinitely. The strongest fact for that read is that free cash flow already fell 15% in 2025 as the deferred-revenue swing turned billings negative (Financials and Estimates); the strongest fact against it is that the decline was concentrated in a US-federal contract-value cliff that largely anniversaries out in 2026 (Contract Value Stall).
Three scenarios
Whether the price is right resolves not in the multiple but in the contract-value and retention data — the cyclical-versus-structural question the report opened with. The three frames below hold that question as the swing variable, carry it through to 2028 adjusted EPS, and apply an exit multiple. They are illustrative, not forecasts, and the fair-value range is most sensitive to the exit multiple assumption.
Fair value = 2028 adjusted EPS × exit P/E. Current price $140.19 (as reported). Derived from the assumptions in the table below; earnings anchors from 2026 guidance [11] and consensus (as reported).
Illustrative scenarios; earnings anchors from 2026 guidance [12] and consensus 2026–27 adjusted EPS of $13.68 and $15.30 (as reported).
The shape is asymmetric: the structural-bear case is a drawdown of roughly a fifth to a third, while the base case is a modest re-rating and the bull case more than doubles the stock. Consensus sits inside the base frame — a mean price target of $162 and a median of $164, with a $120 low and $203 high (as reported). That the lowest published target is only about 14% below the current price is itself a data point: even the sell-side bears are modeling stagnation, not collapse.
The base case turns on the same re-acceleration management has already promised once. On the day the securities class period opens management said contract value would exit 2025 above 7.8% on the way to 12-16%, and instead Insights contract-value growth decelerated every quarter to 0.8% with the technology-sales channel at zero (Management Credibility). The identical 12-16% model has since been reprinted for 2026, so the recovery the base case embeds is the forecast that just failed — a reason to discount it rather than extend it the benefit of the doubt.
The downside floor
For a value investor the asymmetry only matters if the low end is a drawdown rather than a permanent loss. Gartner's balance sheet makes that case directly. Net debt is about 0.8 times adjusted EBITDA and the consolidated leverage ratio is 1.6 times against a bank covenant of 4.0 times [13]. The debt is 100% fixed-rate at a 4.34% blended coupon, and the nearest maturity is $800 million of 2028 notes [14] — comfortably inside $1.7 billion of cash [15], a $1.0 billion undrawn revolver, and more than $1.1 billion of annual free cash flow [16]. All three agencies rate the notes investment grade [17]. Operating cash flow was $1.29 billion in 2025 [18]. The near-term risk to the equity is a lower multiple, not insolvency.
Management is voting with the balance sheet. In the first quarter of 2026 Gartner repurchased 3,310,253 shares at an average of $158.49, against 300,745 shares at $507.65 a year earlier [19] — eleven times the share count at roughly a third of the price. At a 12% free-cash-flow yield, buybacks convert the yield into per-share compounding if the shares are below intrinsic value (Buybacks and Alignment).
The downside case is not insolvency but a further compression of the multiple, driven by the same variable that separates the scenarios. If the erosion is structural rather than cyclical — if AI substitution begins to show in client retention breaking its long-standing 83–86% band [20] — then a 10-times multiple can compress further toward the level a shrinking pure-play carries, and repurchasing stock in a declining franchise destroys value rather than creating it. In that case the stock stays cheap and grows cheaper, and the holding period works against the owner. The data has not yet settled which outcome holds: wallet retention was still below 100% in the first quarter of 2026 (GTS 97%, GBS 98%), while client retention held its band at 85% and 86% [21].
What decides it
Three lines in the filings resolve the scenarios, each checkable each quarter:
- Wallet retention re-crossing 100%. It fell to 96% (GTS) and 99% (GBS) in 2025 [22] and stayed below 100% into Q1 2026 [23]. Recovery above 100% is the cyclical-read confirmation; a second year below, with the federal drag already in the base, locates the erosion in the commercial core.
- Client retention holding 83–86%. It has never left that band and rose to 85% in 2025 [24]. A break below it is the clearest early tell of AI displacement, and would validate the bear multiple.
- Deferred revenue. It grew to $3.02 billion at the end of the first quarter of 2026 from $2.81 billion at year-end [25]; because subscriptions are billed in advance, this line turns before recognized revenue does.
At 10 times earnings with net debt under one turn, the price already discounts durable decline. Whether that discount is a margin of safety or a warning is a question the retention lines will answer before the multiple does.